Marshall Mix Design
Lecture notes in Transportation Systems Engineering
March 19, 2012
The mix design (wetmix) determines the optimum bitumen content.
This is preceded by the dry mix design discussed in the previous chapter.
There are many methods available for mix design which vary in the size of the
test specimen, compaction, and other test specifications.
Marshall method of mix design is the most popular one and is discussed below.
The Marshall stability and flow test provides the performance prediction
measure for the Marshall mix design method. The stability portion of the test
measures the maximum load supported by the test specimen at a loading rate of
50.8 mm/minute.
Load is applied to the specimen till failure, and the maximum load
is designated as stability.
During the loading, an attached dial gauge measures the specimen's plastic flow
(deformation) due to the loading. The flow value is recorded in 0.25 mm
(0.01 inch) increments at the same time when the maximum load is recorded.
The important steps involved in marshal mix design are summarized next.
Approximately 1200gm of aggregates and filler is heated to a temperature of
 . Bitumen is heated to a temperature of
  with the first trial percentage of bitumen (say 3.5 or 4% by weight of the
mineral aggregates). The heated aggregates and bitumen are thoroughly mixed at
a temperature of
with the first trial percentage of bitumen (say 3.5 or 4% by weight of the
mineral aggregates). The heated aggregates and bitumen are thoroughly mixed at
a temperature of  .
The mix is placed in a preheated mould and compacted by a rammer with 50 blows
on either side at temperature of
.
The mix is placed in a preheated mould and compacted by a rammer with 50 blows
on either side at temperature of  to
to  . The weight of mixed
aggregates taken for the preparation of the specimen may be suitably altered to
obtain a compacted thickness of 63.5+/-3 mm.
Vary the bitumen content in the next trial by
. The weight of mixed
aggregates taken for the preparation of the specimen may be suitably altered to
obtain a compacted thickness of 63.5+/-3 mm.
Vary the bitumen content in the next trial by  and repeat the above
procedure. Number of trials are predetermined. The prepared mould is loaded in
the Marshall test setup as shown in the figure 1.
and repeat the above
procedure. Number of trials are predetermined. The prepared mould is loaded in
the Marshall test setup as shown in the figure 1.
Marshall Mould
The properties that are of interest include the theoretical specific gravity
 , the bulk specific gravity of the mix
  , percent air voids
  ,
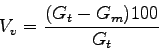
percent volume of bitumen
,
percent volume of bitumen  , percent void in mixed aggregate VMA and
percent voids filled with bitumen VFB.
These calculations are discussed next.
To understand these calculation a phase diagram is given in Figure 2.
, percent void in mixed aggregate VMA and
percent voids filled with bitumen VFB.
These calculations are discussed next.
To understand these calculation a phase diagram is given in Figure 2.
Figure 2:
Phase diagram of a bituminous mix
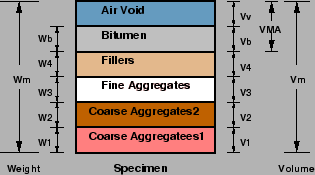 |
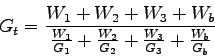
Theoretical specific gravity is the specific gravity without considering
air voids, and is given by:
 |
(1) |
where,
 is the weight of coarse aggregate in the total mix,
 is the weight of fine aggregate in the total mix,
 is the weight of filler in the total mix,
 is the weight of bitumen in the total mix,
 is the apparent specific gravity of coarse aggregate,
 is the apparent specific gravity of fine aggregate,
 is the apparent specific gravity of filler and
 is the apparent specific gravity of bitumen,
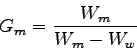
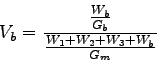
The bulk specific gravity or the actual specific gravity of the mix is
the specific gravity considering air voids and is found out by:
is the apparent specific gravity of bitumen,
The bulk specific gravity or the actual specific gravity of the mix is
the specific gravity considering air voids and is found out by:
 |
(2) |
where,
 is the weight of mix in air,
 is the weight of mix in water,
Note that
is the weight of mix in water,
Note that  gives the volume of the mix.
Sometimes to get accurate bulk specific gravity, the specimen is coated with
thin film of paraffin wax, when weight is taken in the water.
This, however requires to consider the weight and volume of wax in the calculations.
gives the volume of the mix.
Sometimes to get accurate bulk specific gravity, the specimen is coated with
thin film of paraffin wax, when weight is taken in the water.
This, however requires to consider the weight and volume of wax in the calculations.
Air voids is the percent of air voids by volume in the specimen and is
given by:
 |
(3) |
where is the theoretical specific gravity of the mix, given by equation
26.1.
and is the bulk or actual specific gravity of the mix given by equation
26.2.
The volume of bitumen is the percent of volume of bitumen to the total
volume and given by:
 |
(4) |
where,
is the weight of coarse aggregate in the total mix,
is the weight of fine aggregate in the total mix,
is the weight of filler in the total mix,
is the weight of bitumen in the total mix,
is the apparent specific gravity of bitumen, and
is the bulk specific gravity of mix given by equation 26.2.
Voids in mineral aggregate  is the volume of voids in the aggregates, and
is the sum of air voids and volume of bitumen, and
is calculated from
is the volume of voids in the aggregates, and
is the sum of air voids and volume of bitumen, and
is calculated from
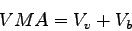 |
(5) |
where, is the percent air voids in the mix, given by equation 26.3.
and is percent bitumen content in the mix, given by equation 26.4.
(4).
Voids filled with bitumen  is the voids in the mineral aggregate frame
work filled with the bitumen, and is calculated as:
is the voids in the mineral aggregate frame
work filled with the bitumen, and is calculated as:
 |
(6) |
where, is percent bitumen content in the mix, given by equation 26.4.
and is the percent voids in the mineral aggregate, given by equation 26.5.
Marshall stability of a test specimen is the maximum load required to produce
failure when the specimen is preheated to a prescribed temperature placed in a
special test head and the load is applied at a constant strain (5 cm per
minute).
While the stability test is in progress dial gauge is used to measure the
vertical deformation of the specimen.
The deformation at the failure point expressed in units of 0.25 mm is called
the Marshall flow value of the specimen.
It is possible while making the specimen the thickness slightly vary from the
standard specification of 63.5 mm.
Therefore, measured stability values need to be corrected to those which would
have been obtained if the specimens had been exactly 63.5 mm.
This is done by multiplying each measured stability value by an appropriated
correlation factors as given in Table below.
Table 1:
Correction factors for Marshall stability values
| Volume of |
Thickness |
Correction |
| specimen |
of specimen |
Factor |
(cm ) ) |
(mm) |
|
| 457 - 470 |
57.1 |
1.19 |
| 471 - 482 |
68.7 |
1.14 |
| 483 - 495 |
60.3 |
1.09 |
| 496 - 508 |
61.9 |
1.04 |
| 509 - 522 |
63.5 |
1.00 |
| 523 - 535 |
65.1 |
0.96 |
| 536 - 546 |
66.7 |
0.93 |
| 547 - 559 |
68.3 |
0.89 |
| 560 - 573 |
69.9 |
0.86 |
The average value of the above properties are determined for each mix with
different bitumen content and the following graphical plots are prepared:
- Binder content versus corrected Marshall stability
- Binder content versus Marshall flow
- Binder content versus percentage of void () in the total mix
- Binder content versus voids filled with bitumen ()
- Binder content versus unit weight or bulk specific gravity ()
Determine the optimum binder content for the mix design by taking average value
of the following three bitumen contents found form the graphs obtained in the
previous step.
- Binder content corresponding to maximum stability
- Binder content corresponding to maximum bulk specific gravity ()
- Binder content corresponding to the median of designed limits of percent
air voids () in the total mix (i.e. 4%)
The stability value, flow value, and are checked with Marshall mix
design specification chart given in Table below.
Mixes with very high stability value and low flow value are not desirable as
the pavements constructed with such mixes are likely to develop cracks due to
heavy moving loads.
Table 2:
Marshall mix design specification
| Test Property |
Specified Value |
| Marshall stability, kg |
340 (minimum) |
| Flow value, 0.25 mm units |
8 - 17 |
| Percent air voids in the mix % |
3 - 5 |
| Voids filled with bitumen % |
75 - 85 |
Marshall Curves
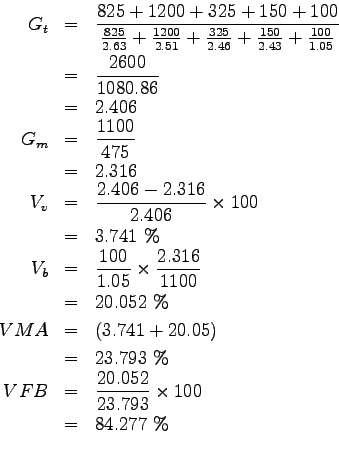
The specific gravities and weight proportions for aggregate and bitumen
are as under for the preparation of Marshall mix design.
The volume and weight of one Marshall specimen was found to be 475 cc and 1100
gm. Assuming absorption of bitumen in aggregate is zero, find , ,
and ;
| Item |
A_1 |
A_2 |
A_3 |
A_4 |
B |
| Wt (gm) |
825 |
1200 |
325 |
150 |
100 |
| Sp. Gr |
2.63 |
2.51 |
2.46 |
2.43 |
1.05 |
The results of Marshall test for five specimen is given below.
Find the optimum bitumen content of the mix.
| Bitumen |
Stability |
Flow |
|
|
|
| content |
(kg) |
(units) |
(%) |
(%) |
|
| 3 |
499.4 |
9.0 |
12.5 |
34 |
2.17 |
| 4 |
717.3 |
9.6 |
7.2 |
65 |
2.21 |
| 5 |
812.7 |
12.0 |
3.9 |
84 |
2.26 |
| 6 |
767.3 |
14.8 |
2.4 |
91 |
2.23 |
| 7 |
662.8 |
19.5 |
1.9 |
93 |
2.18 |
Plot the graphs and find bitumen content corresponding to
- Max stability = 5 percent bitumen content.
- Max = 5 percent bitumen content.
- 4% percent air void = 3 percent bitumen content.
The optimum bitumen extent is the average of above = 4.33 percent.
Marshal stability test is the performance prediction measure conducted on the
bituminous nix.
The procedure consists of determination of properties of mix, Marshal stability
and flow analysis and finally determination of optimum bitumen content.
The concept of phase diagram is used for the calculations.
- In Marshall stability test, the sample is compacted using a rammer giving
- 50 blows
- 20 blows
- 25 blows
- 75 blows
- The Marshall flow value is expressed in units of
- 25 mm
- 2.5mm
- 5mm
- 3mm
- In Marshall stability test, the sample is compacted using a rammer giving
- 50 blows

- 20 blows
- 25 blows
- 75 blows
- The Marshall flow value is expressed in units of
- 25 mm
- 2.5mm
- 5mm
- 3mm
Prof. Tom V. Mathew
2012-03-19