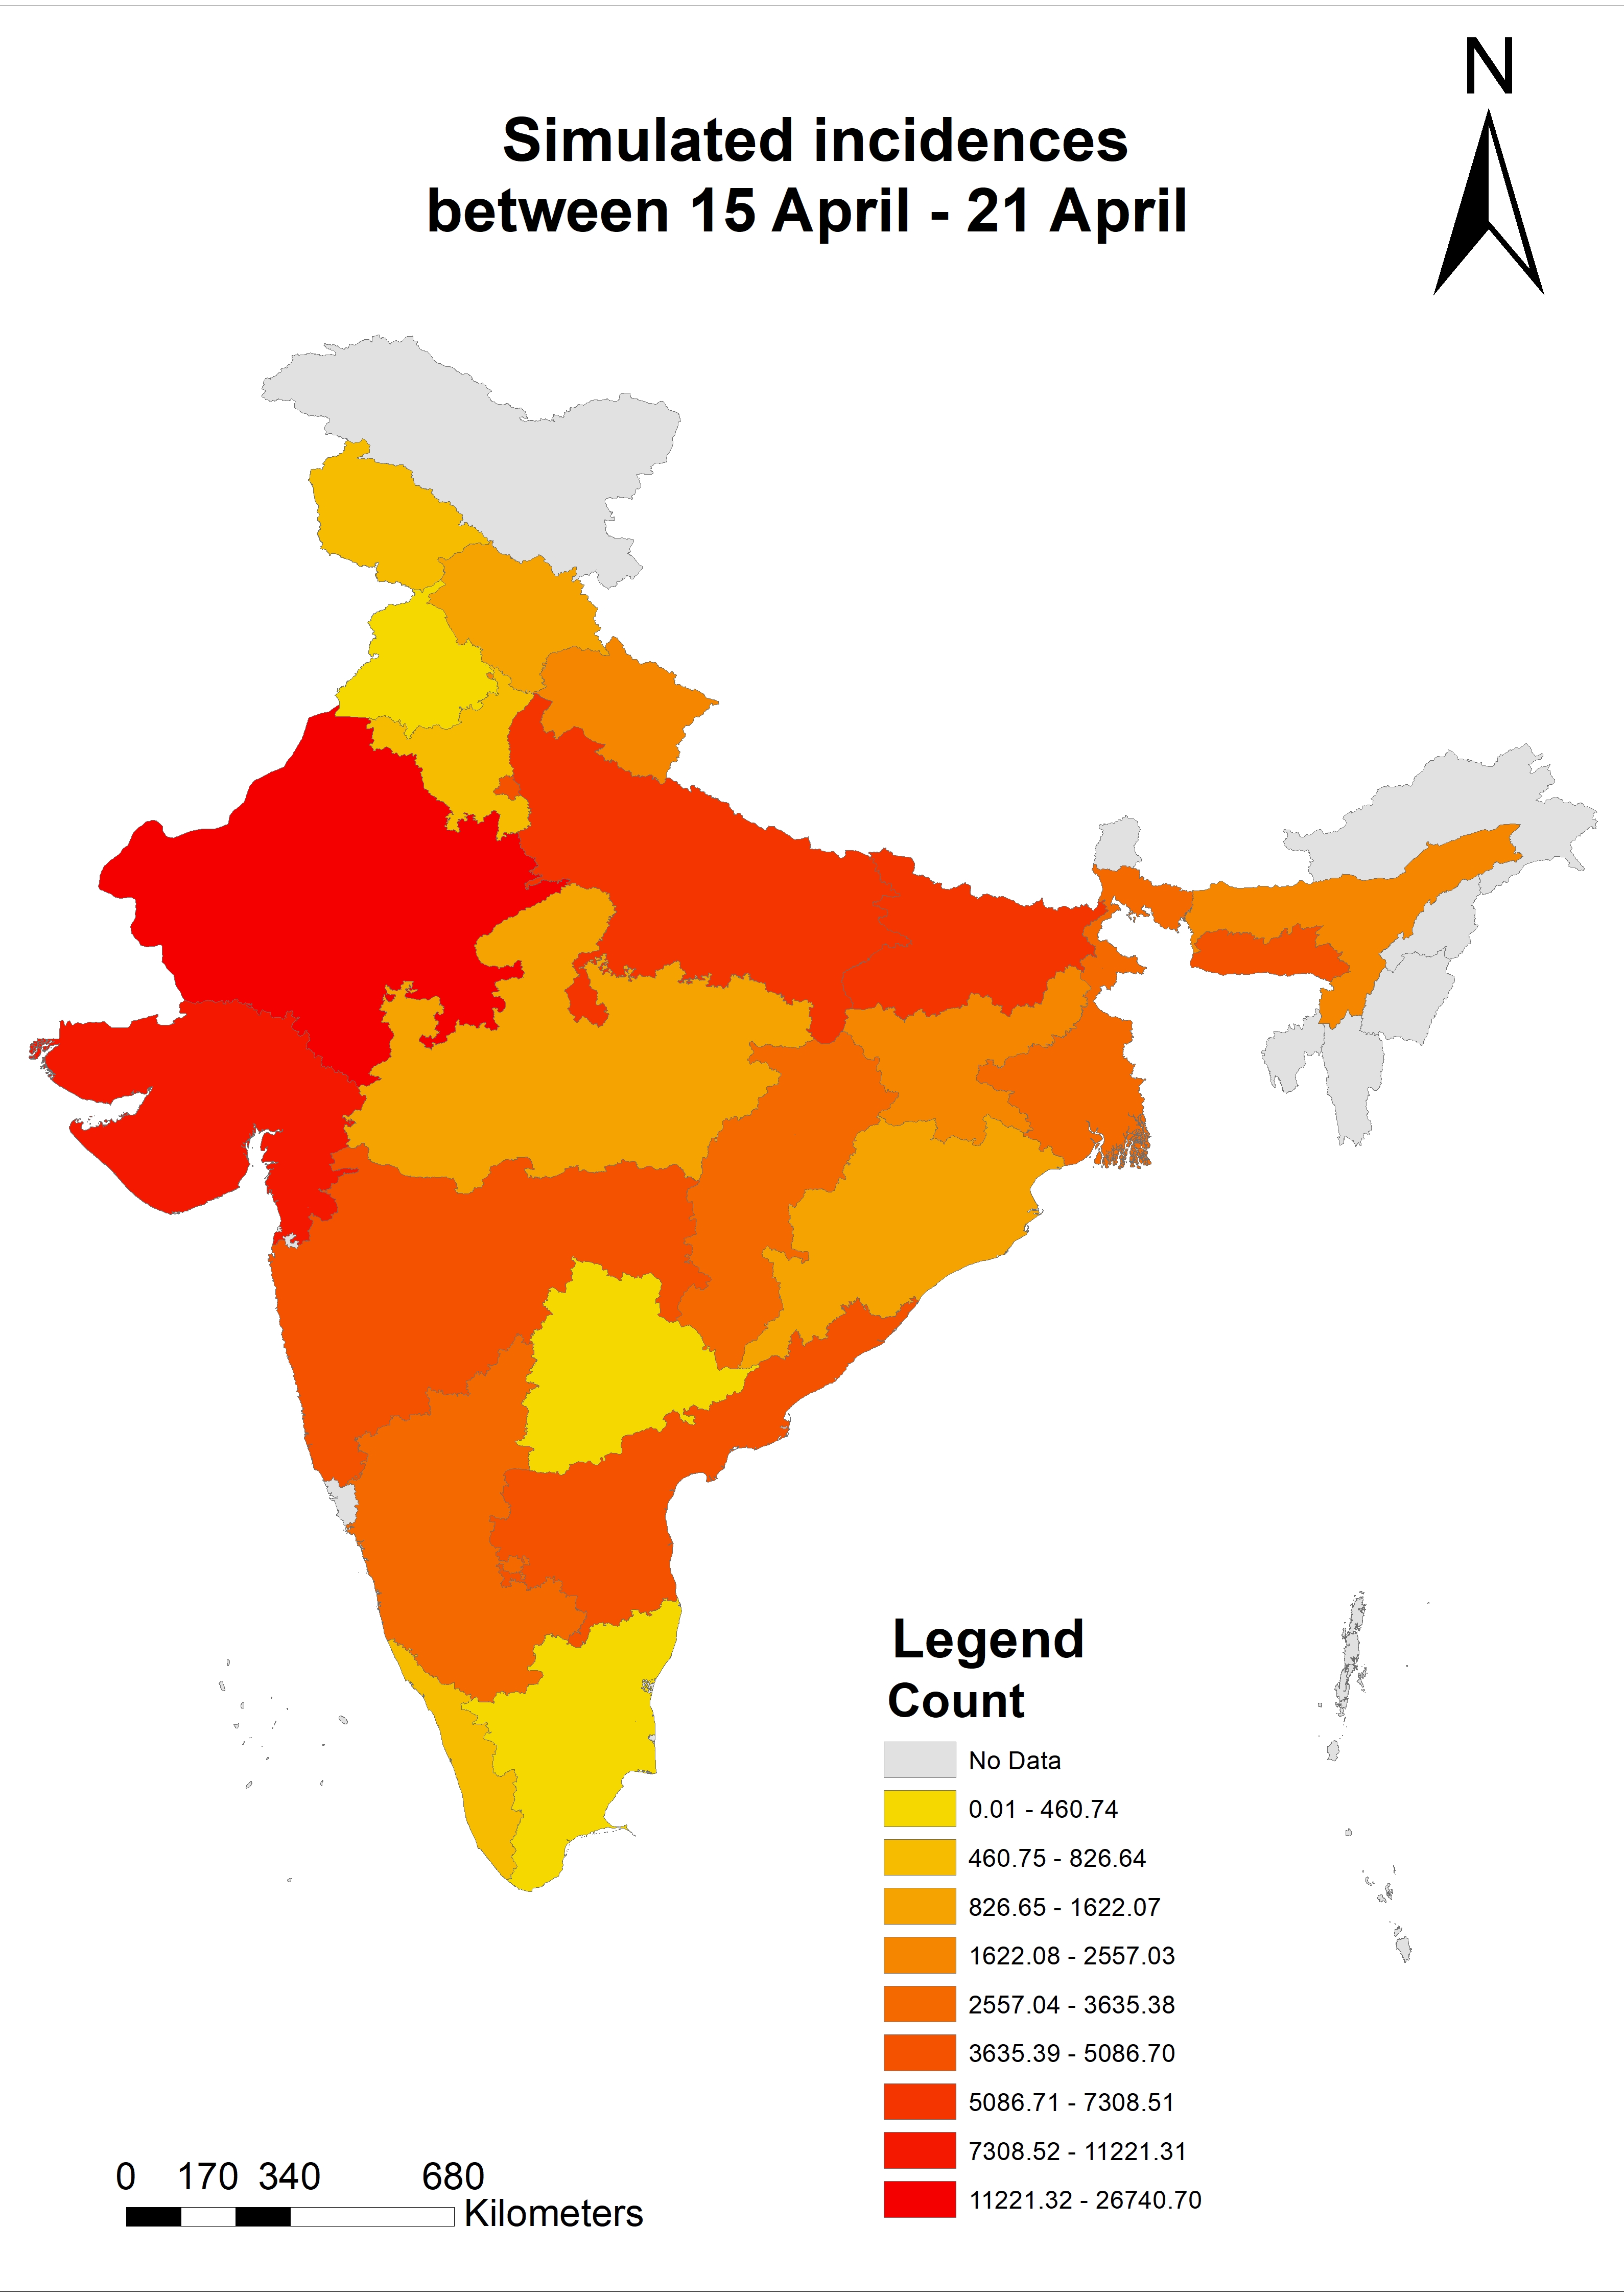
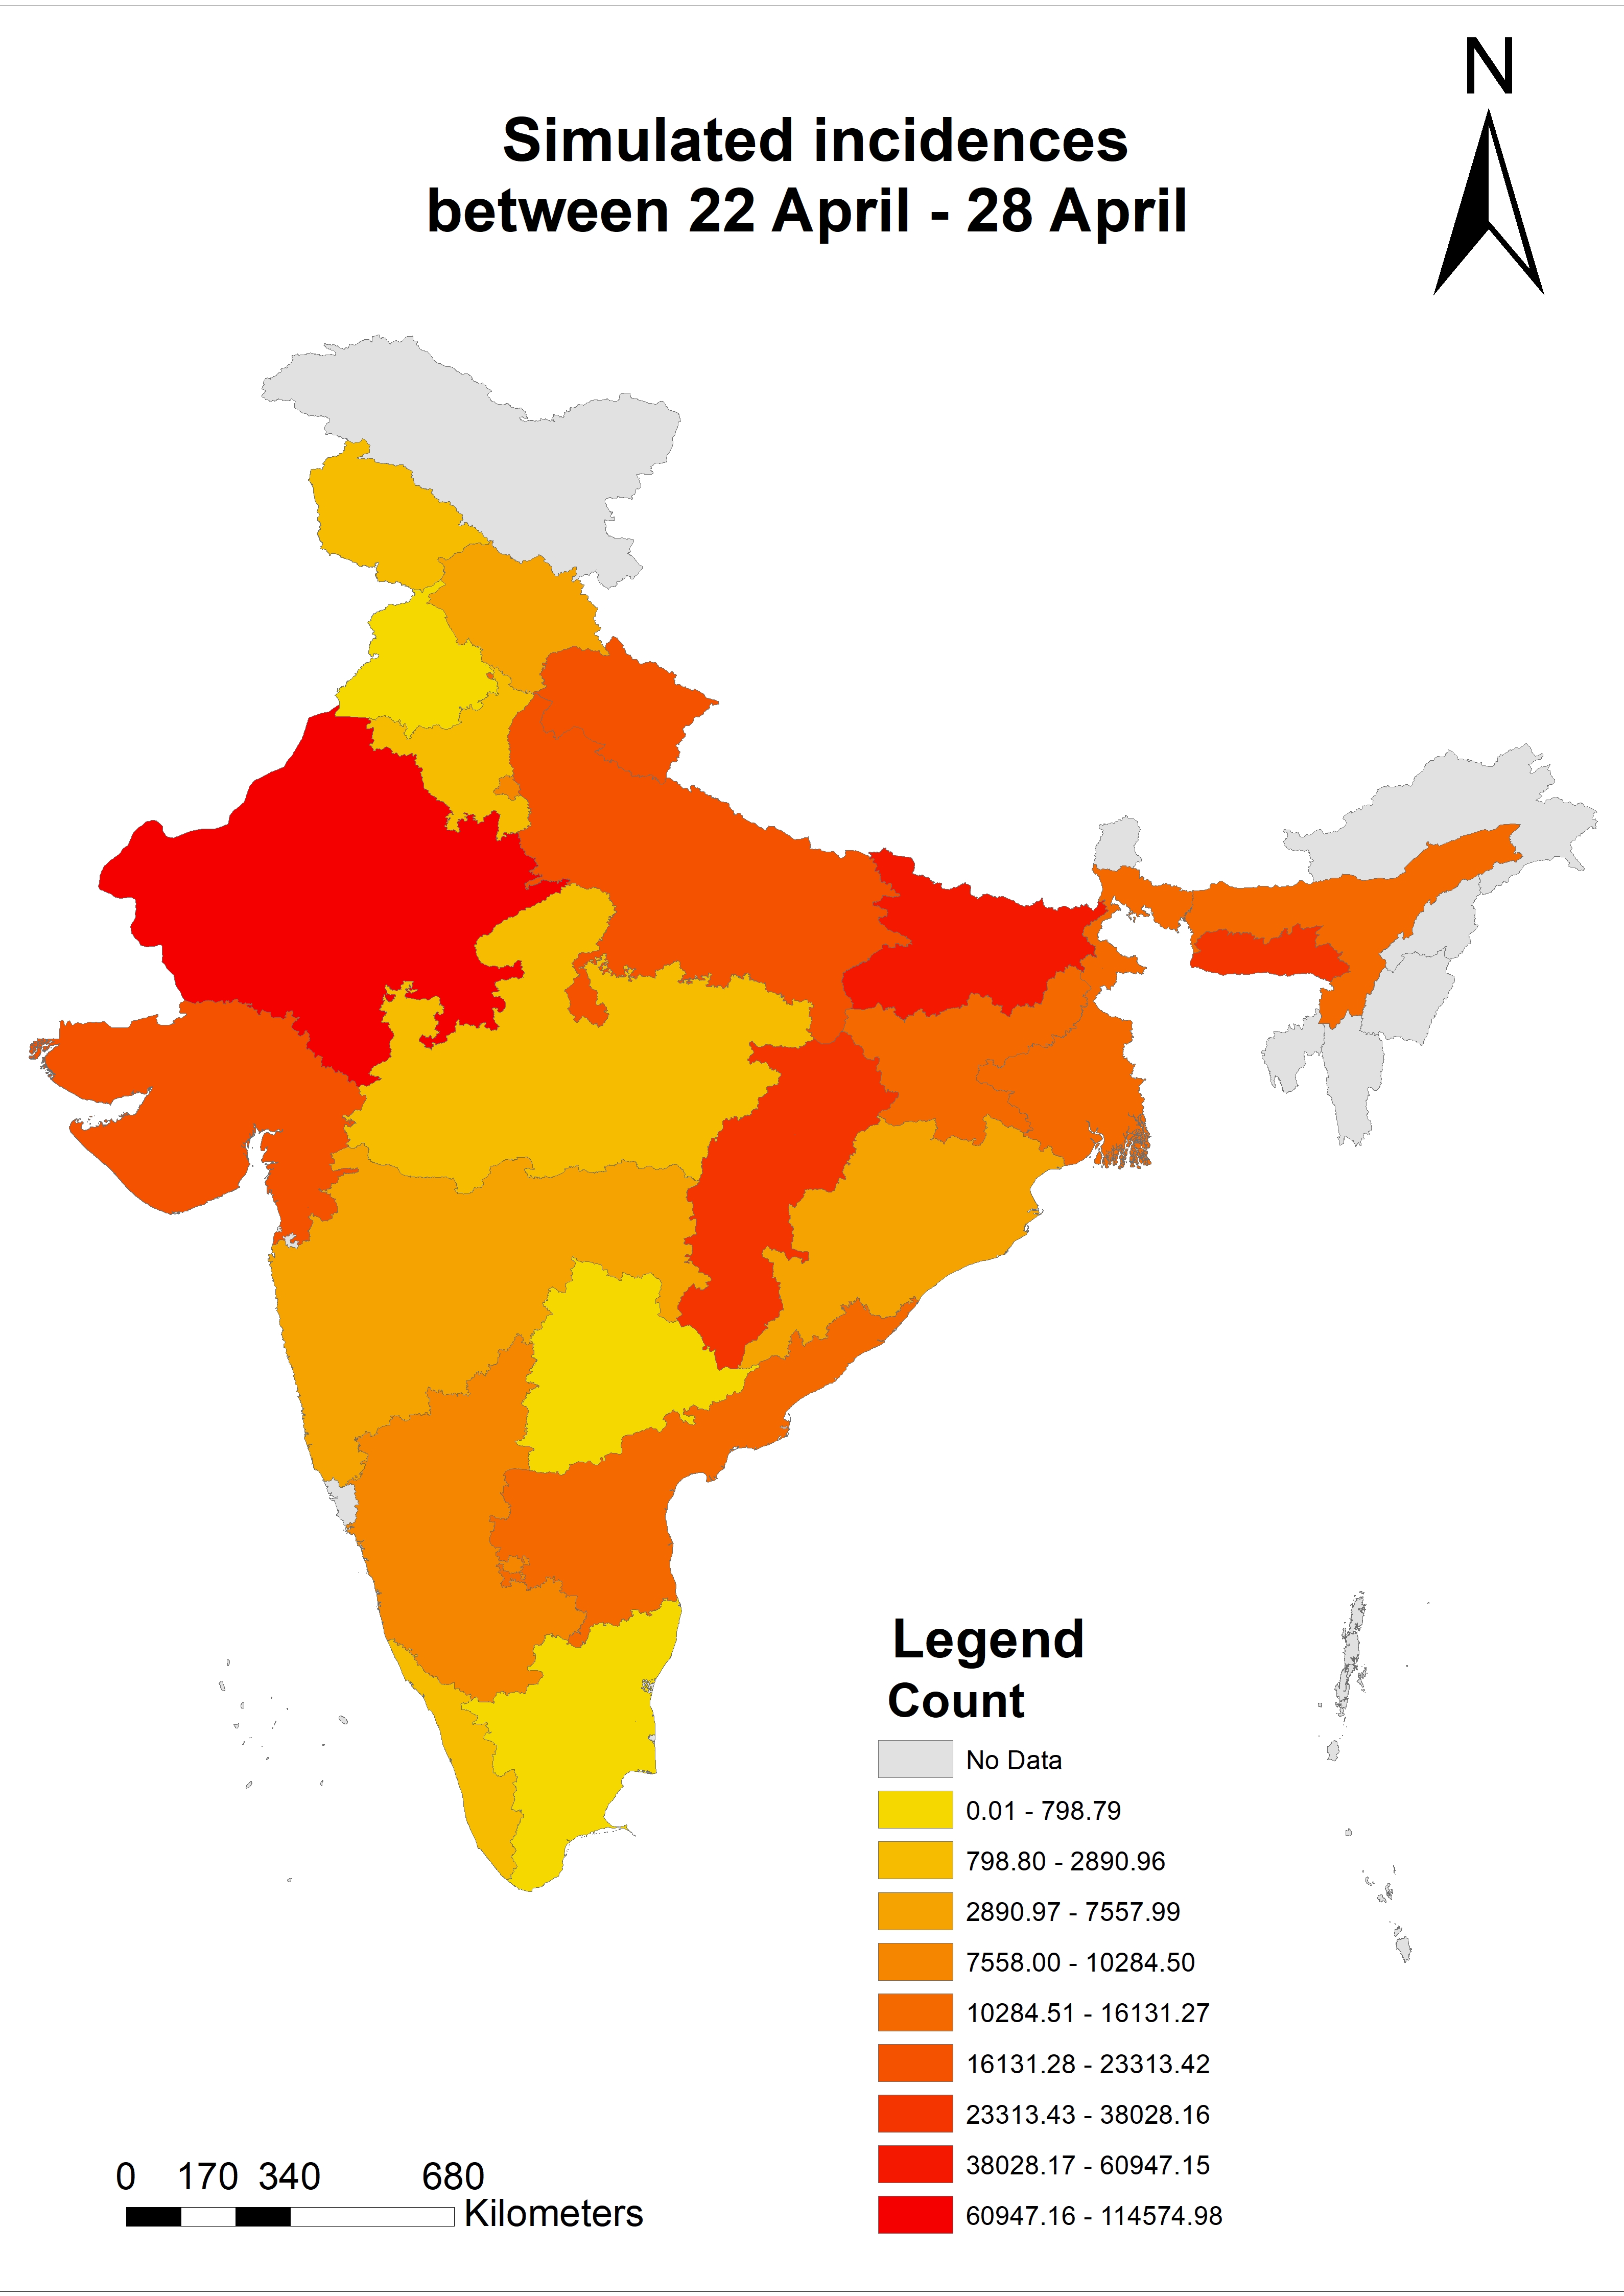
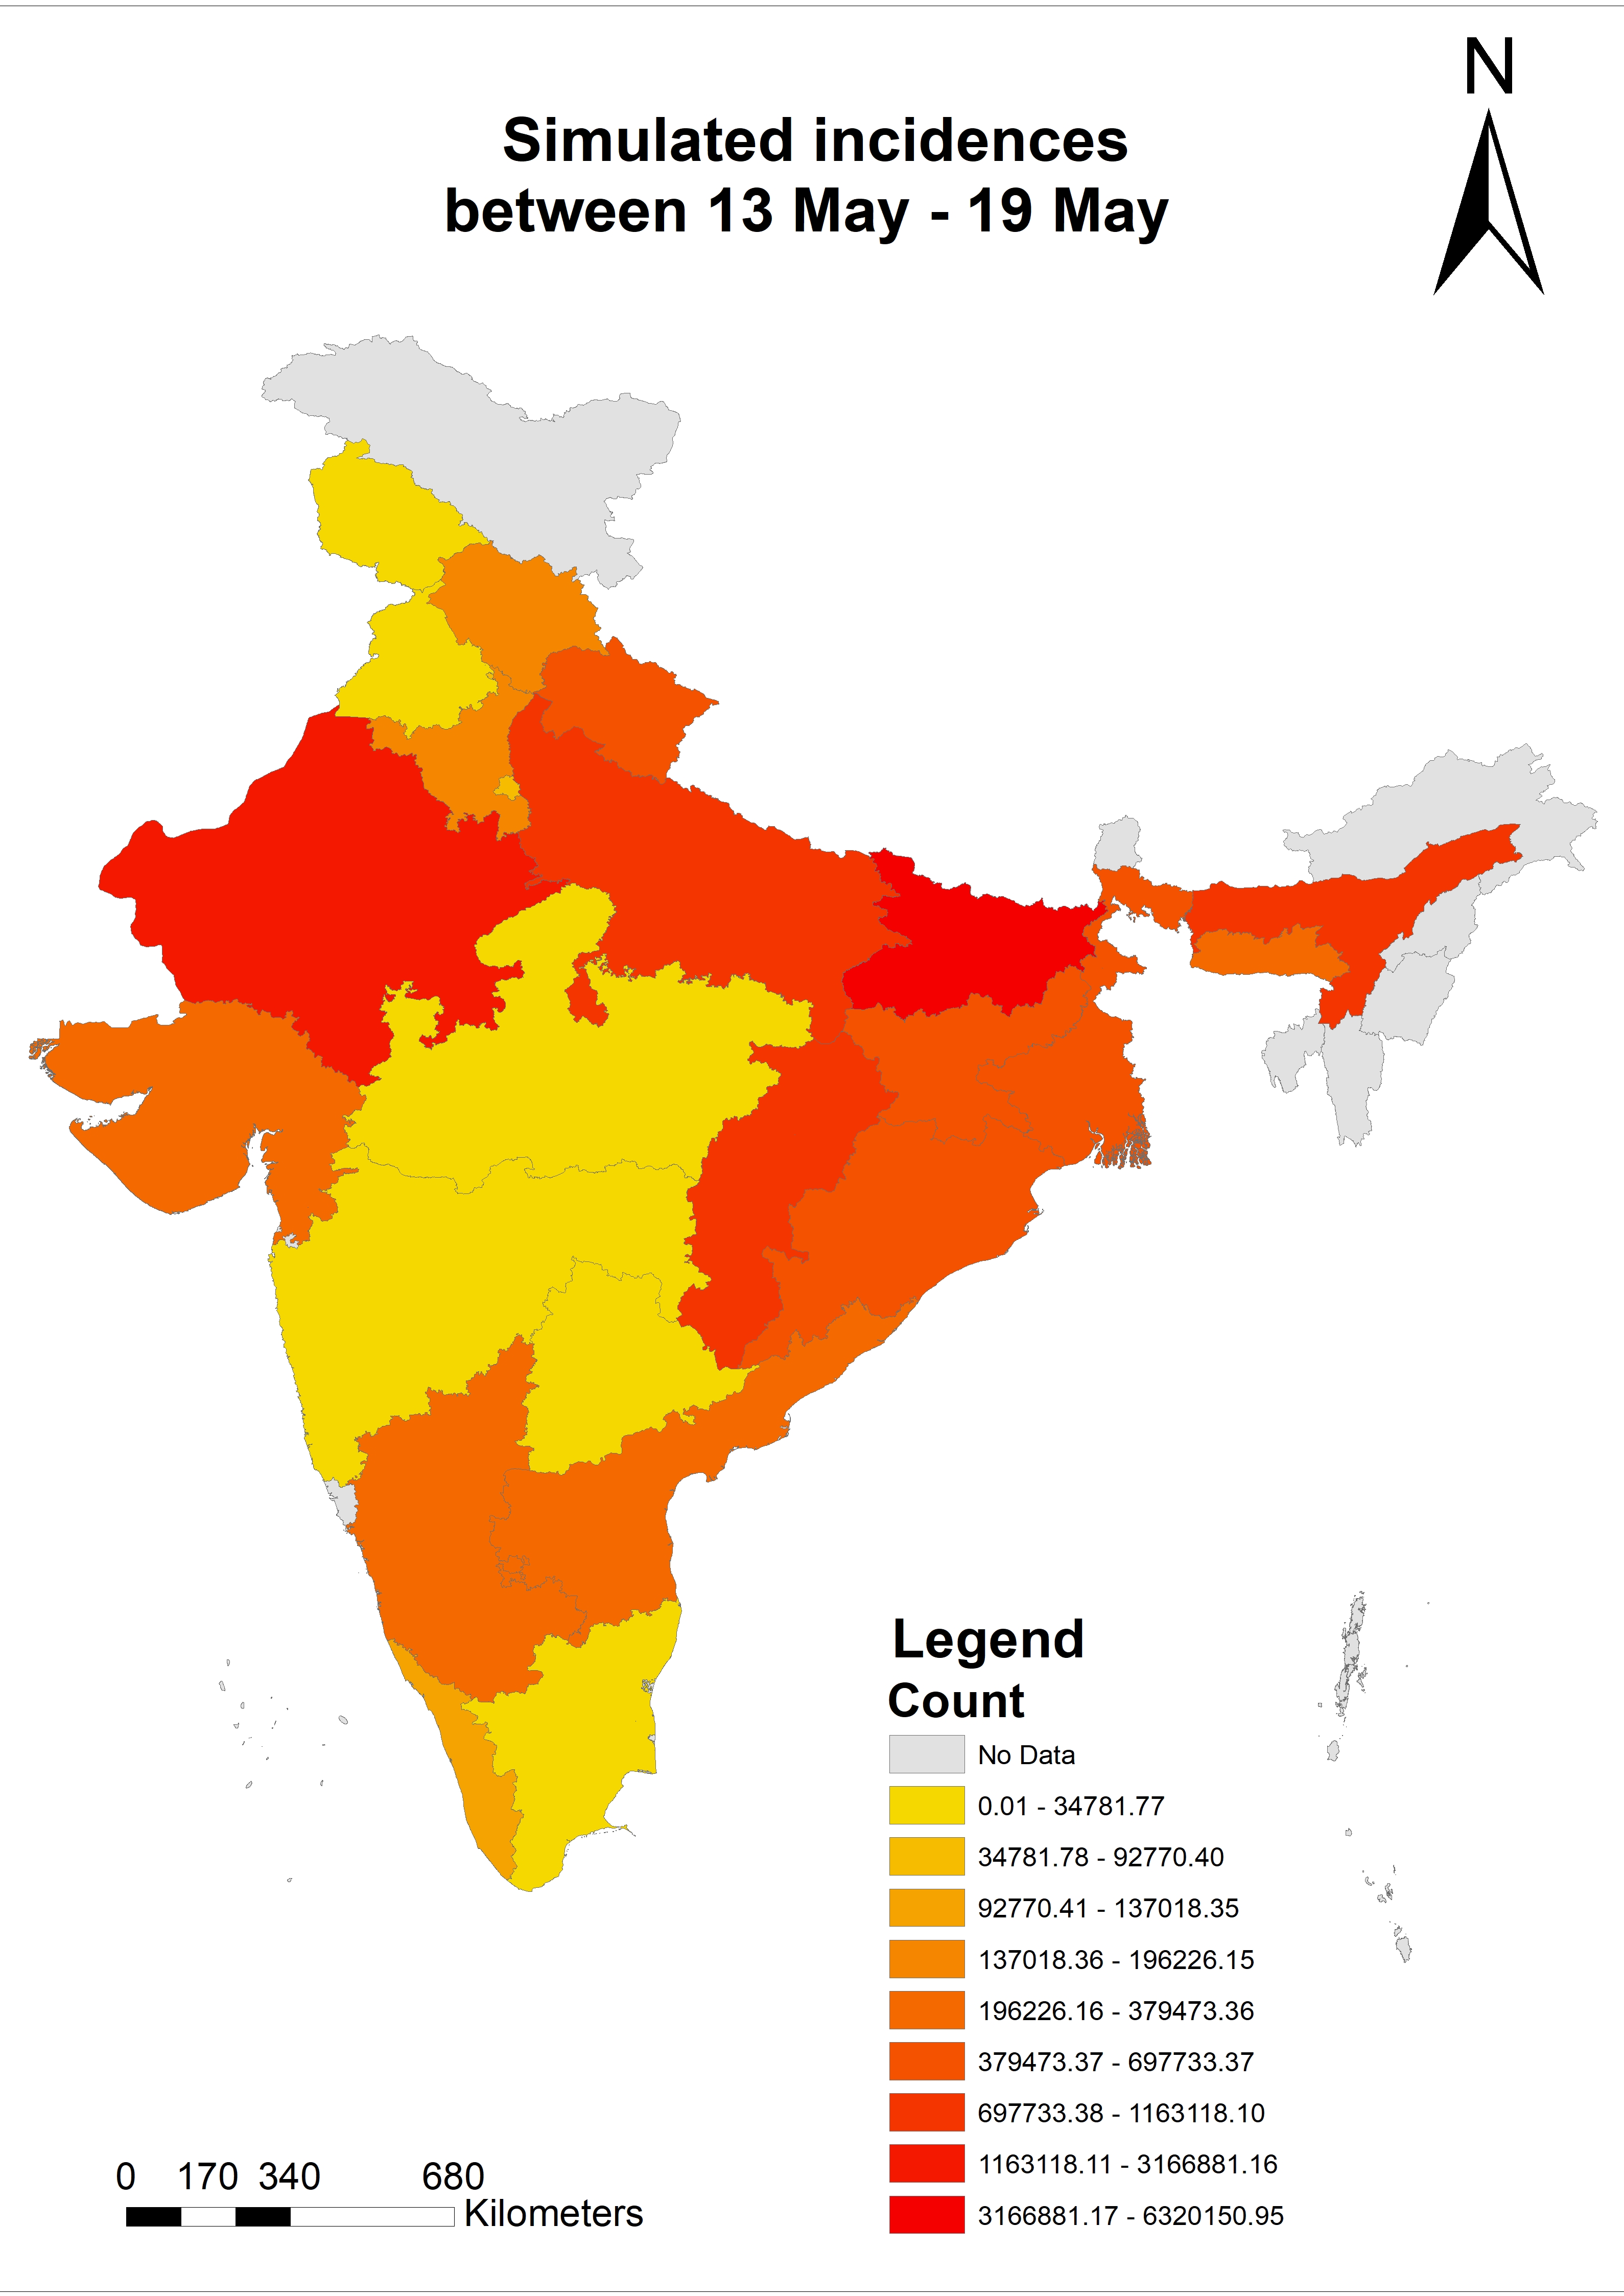
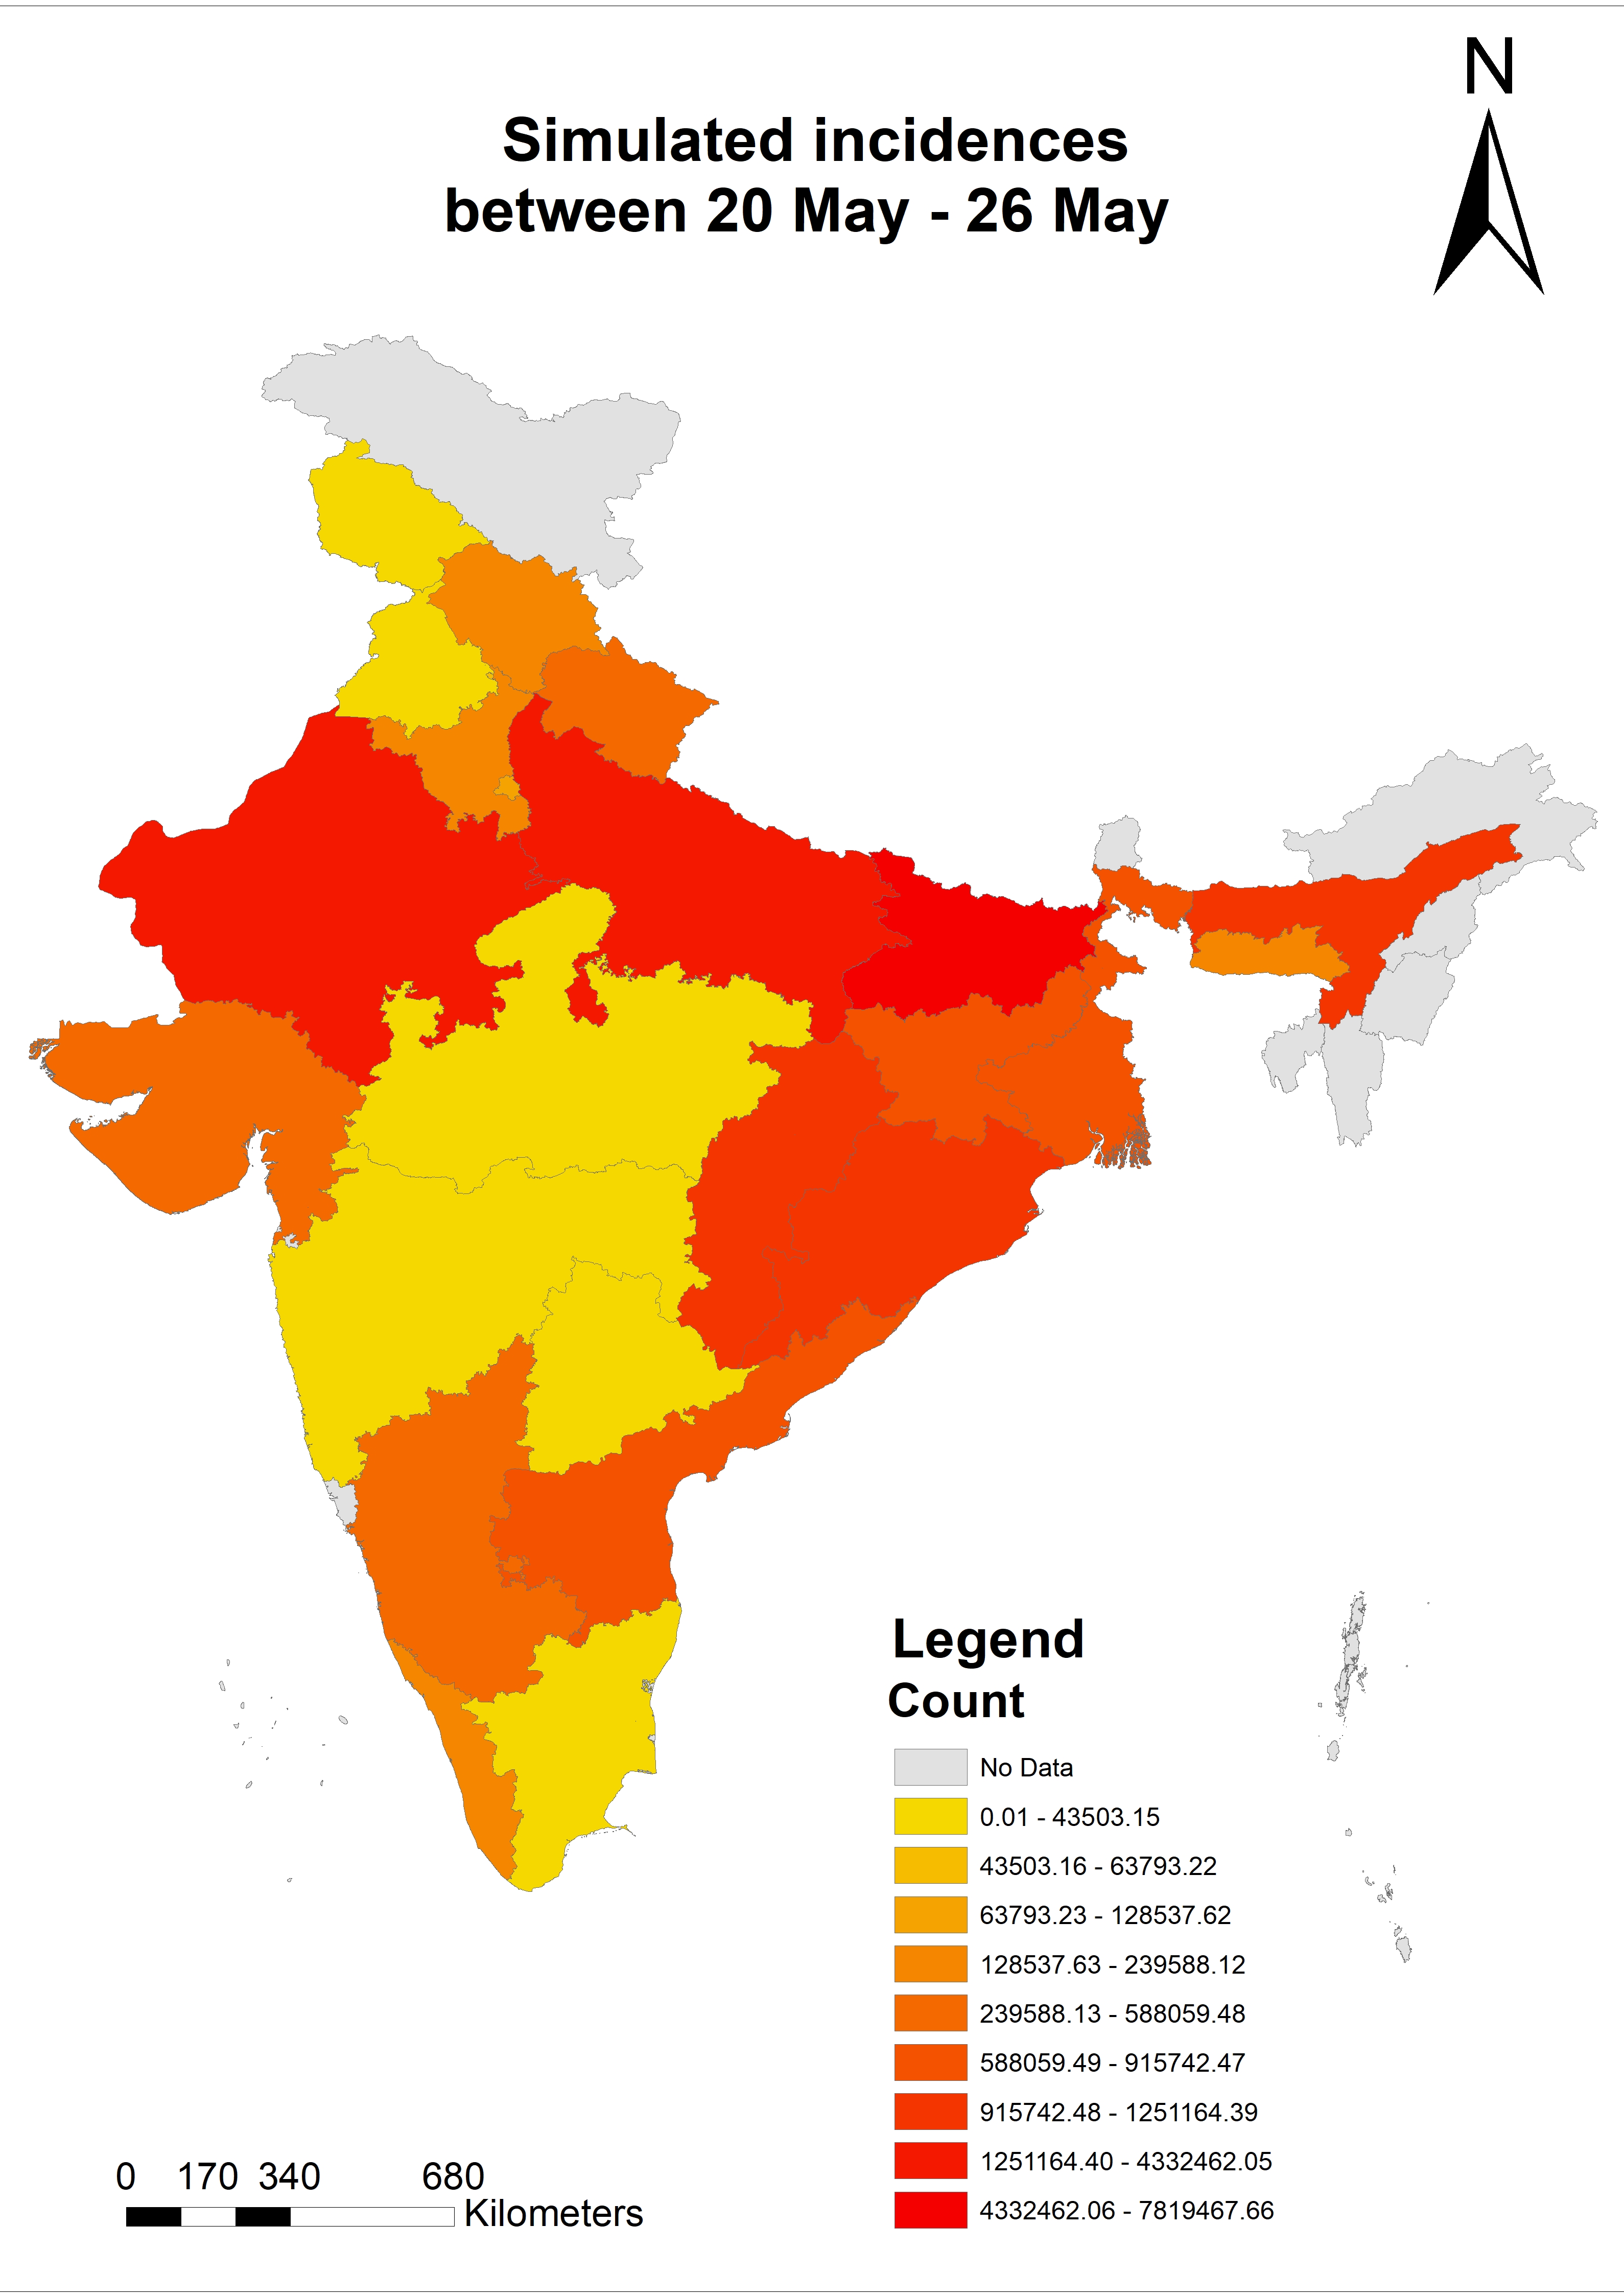
Experimental Epidemiological Prediction Model
Intervention 1B: No extension of lockdown With continued testing at same rate
** All maps are on different colorscale. Inferences should be made using the data provided in the image legend
| Week | System Dynamics Model | Statistical Model | X-SEAIPR Model | Last updated |
|---|---|---|---|---|
| 15 April - 21 April | 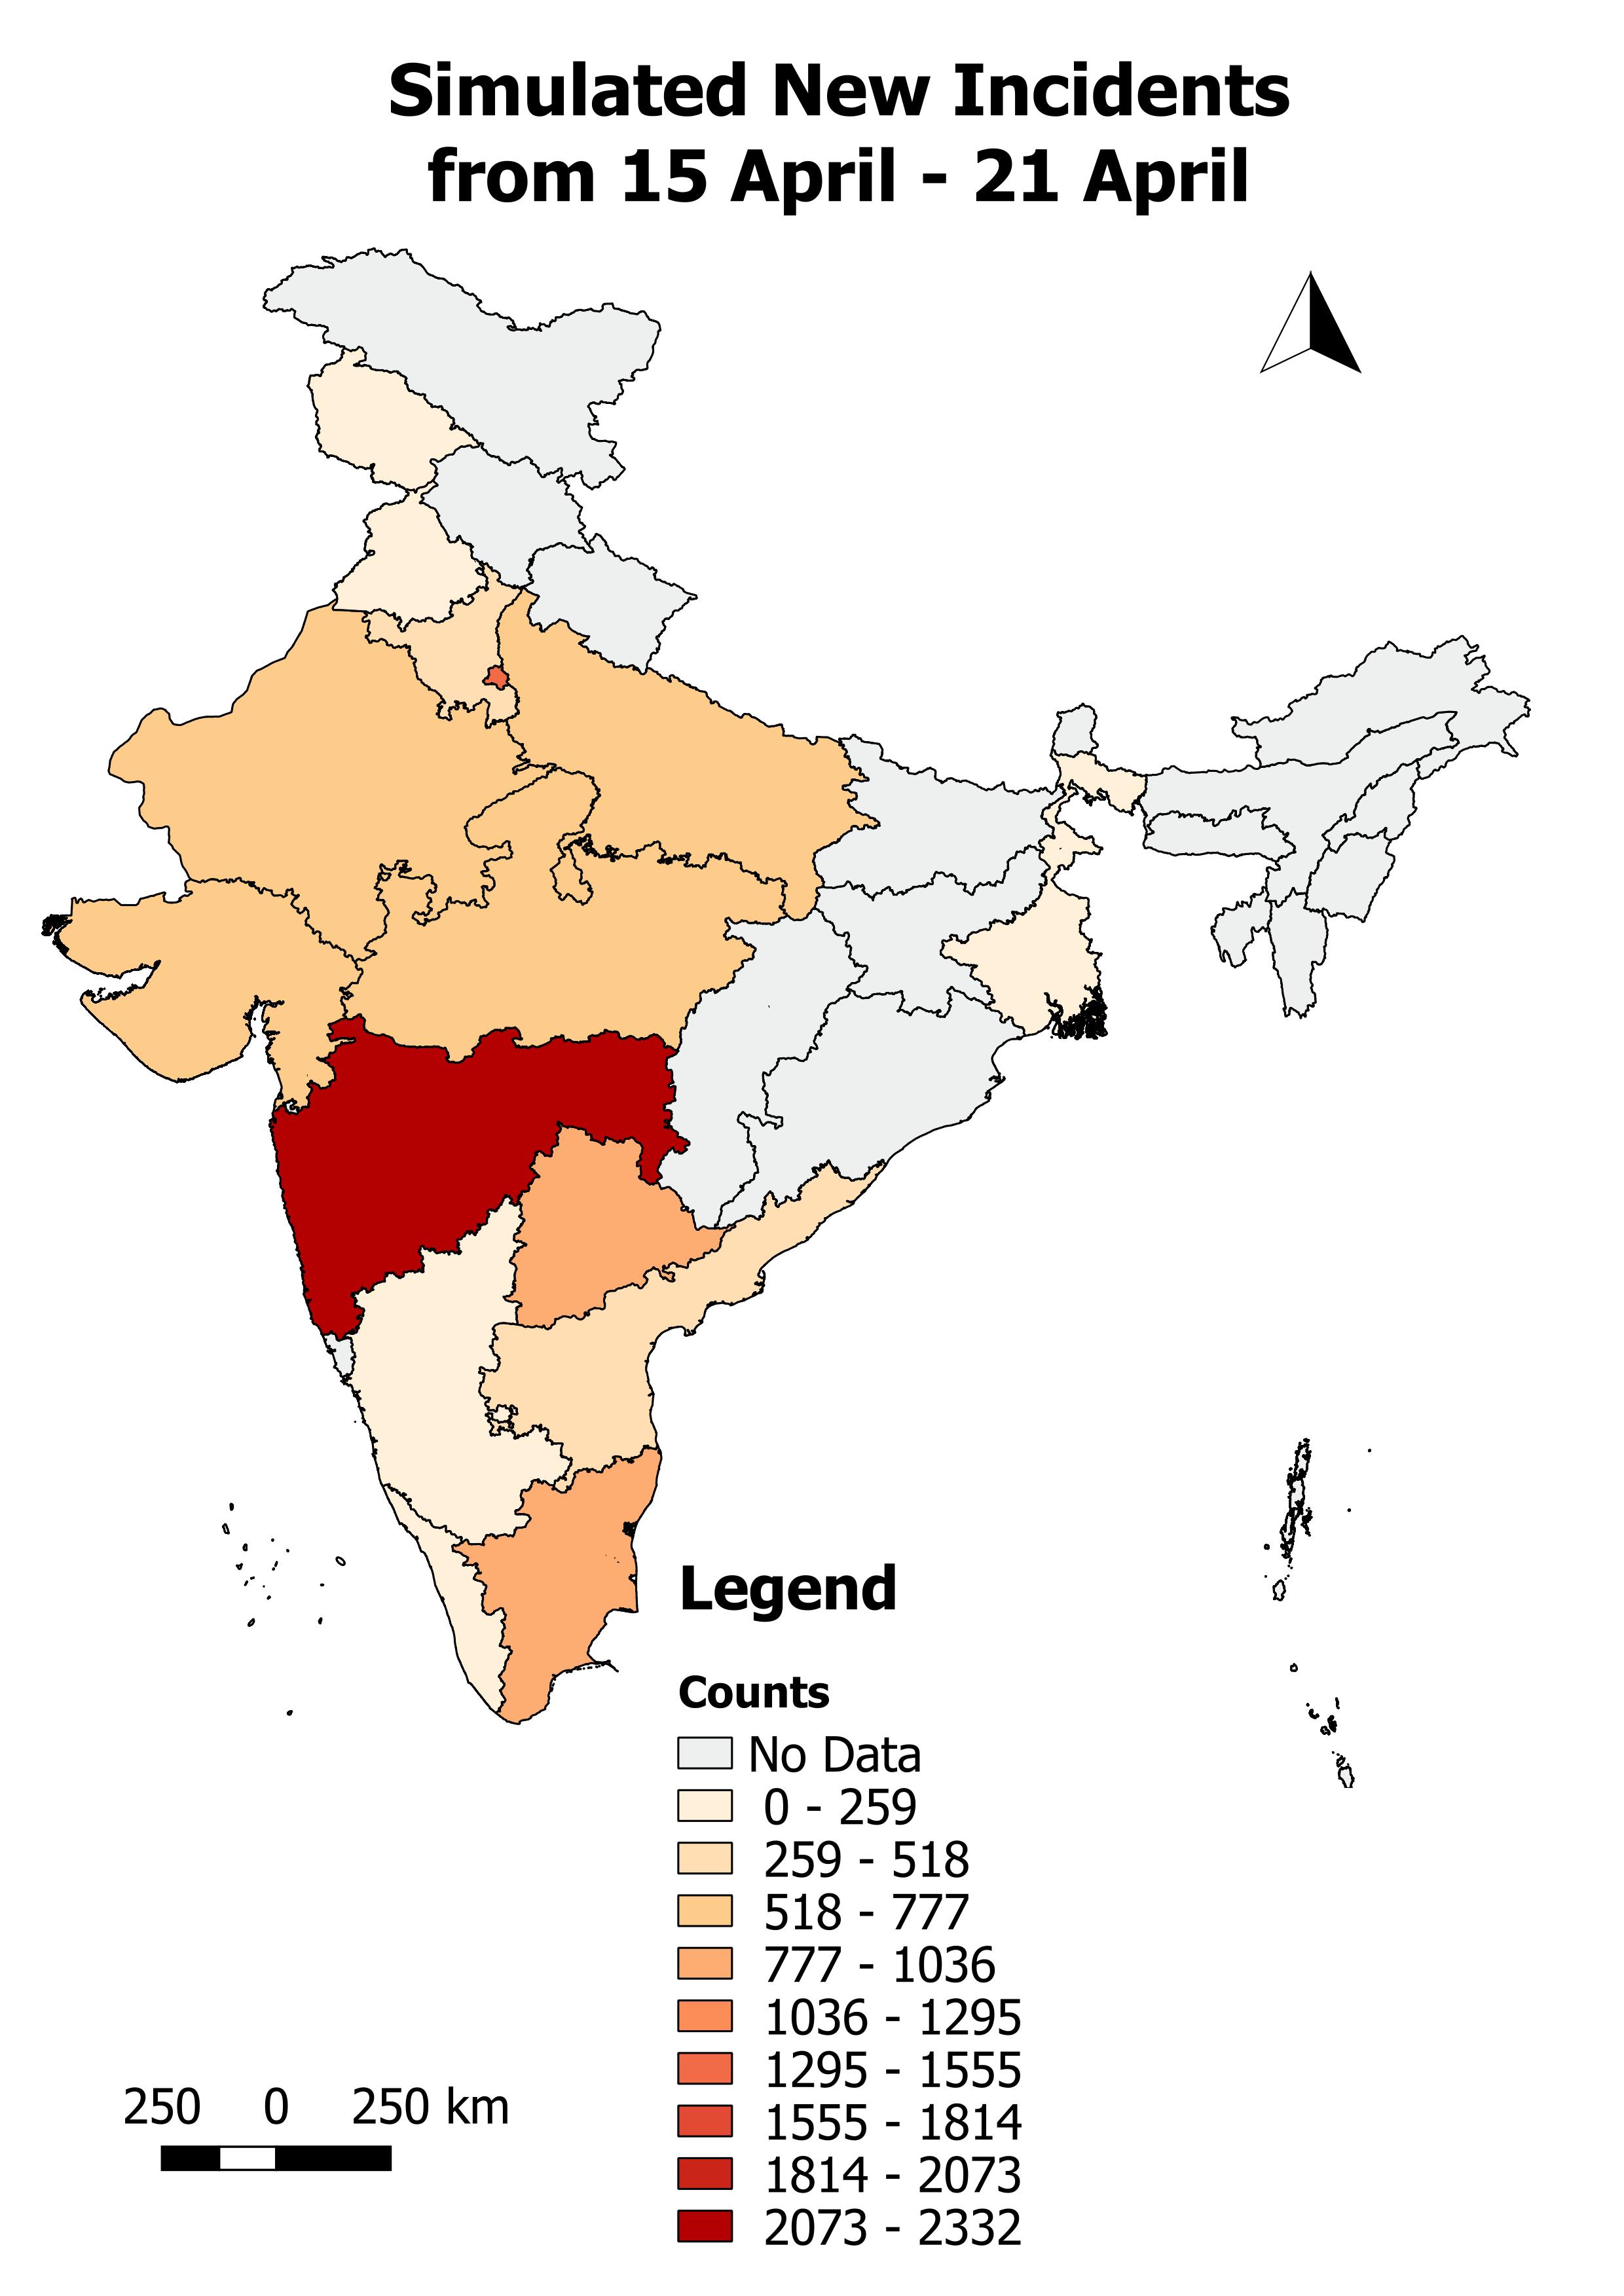 |
 |
 |
12th April 2020 |
| 22 April - 28 April | 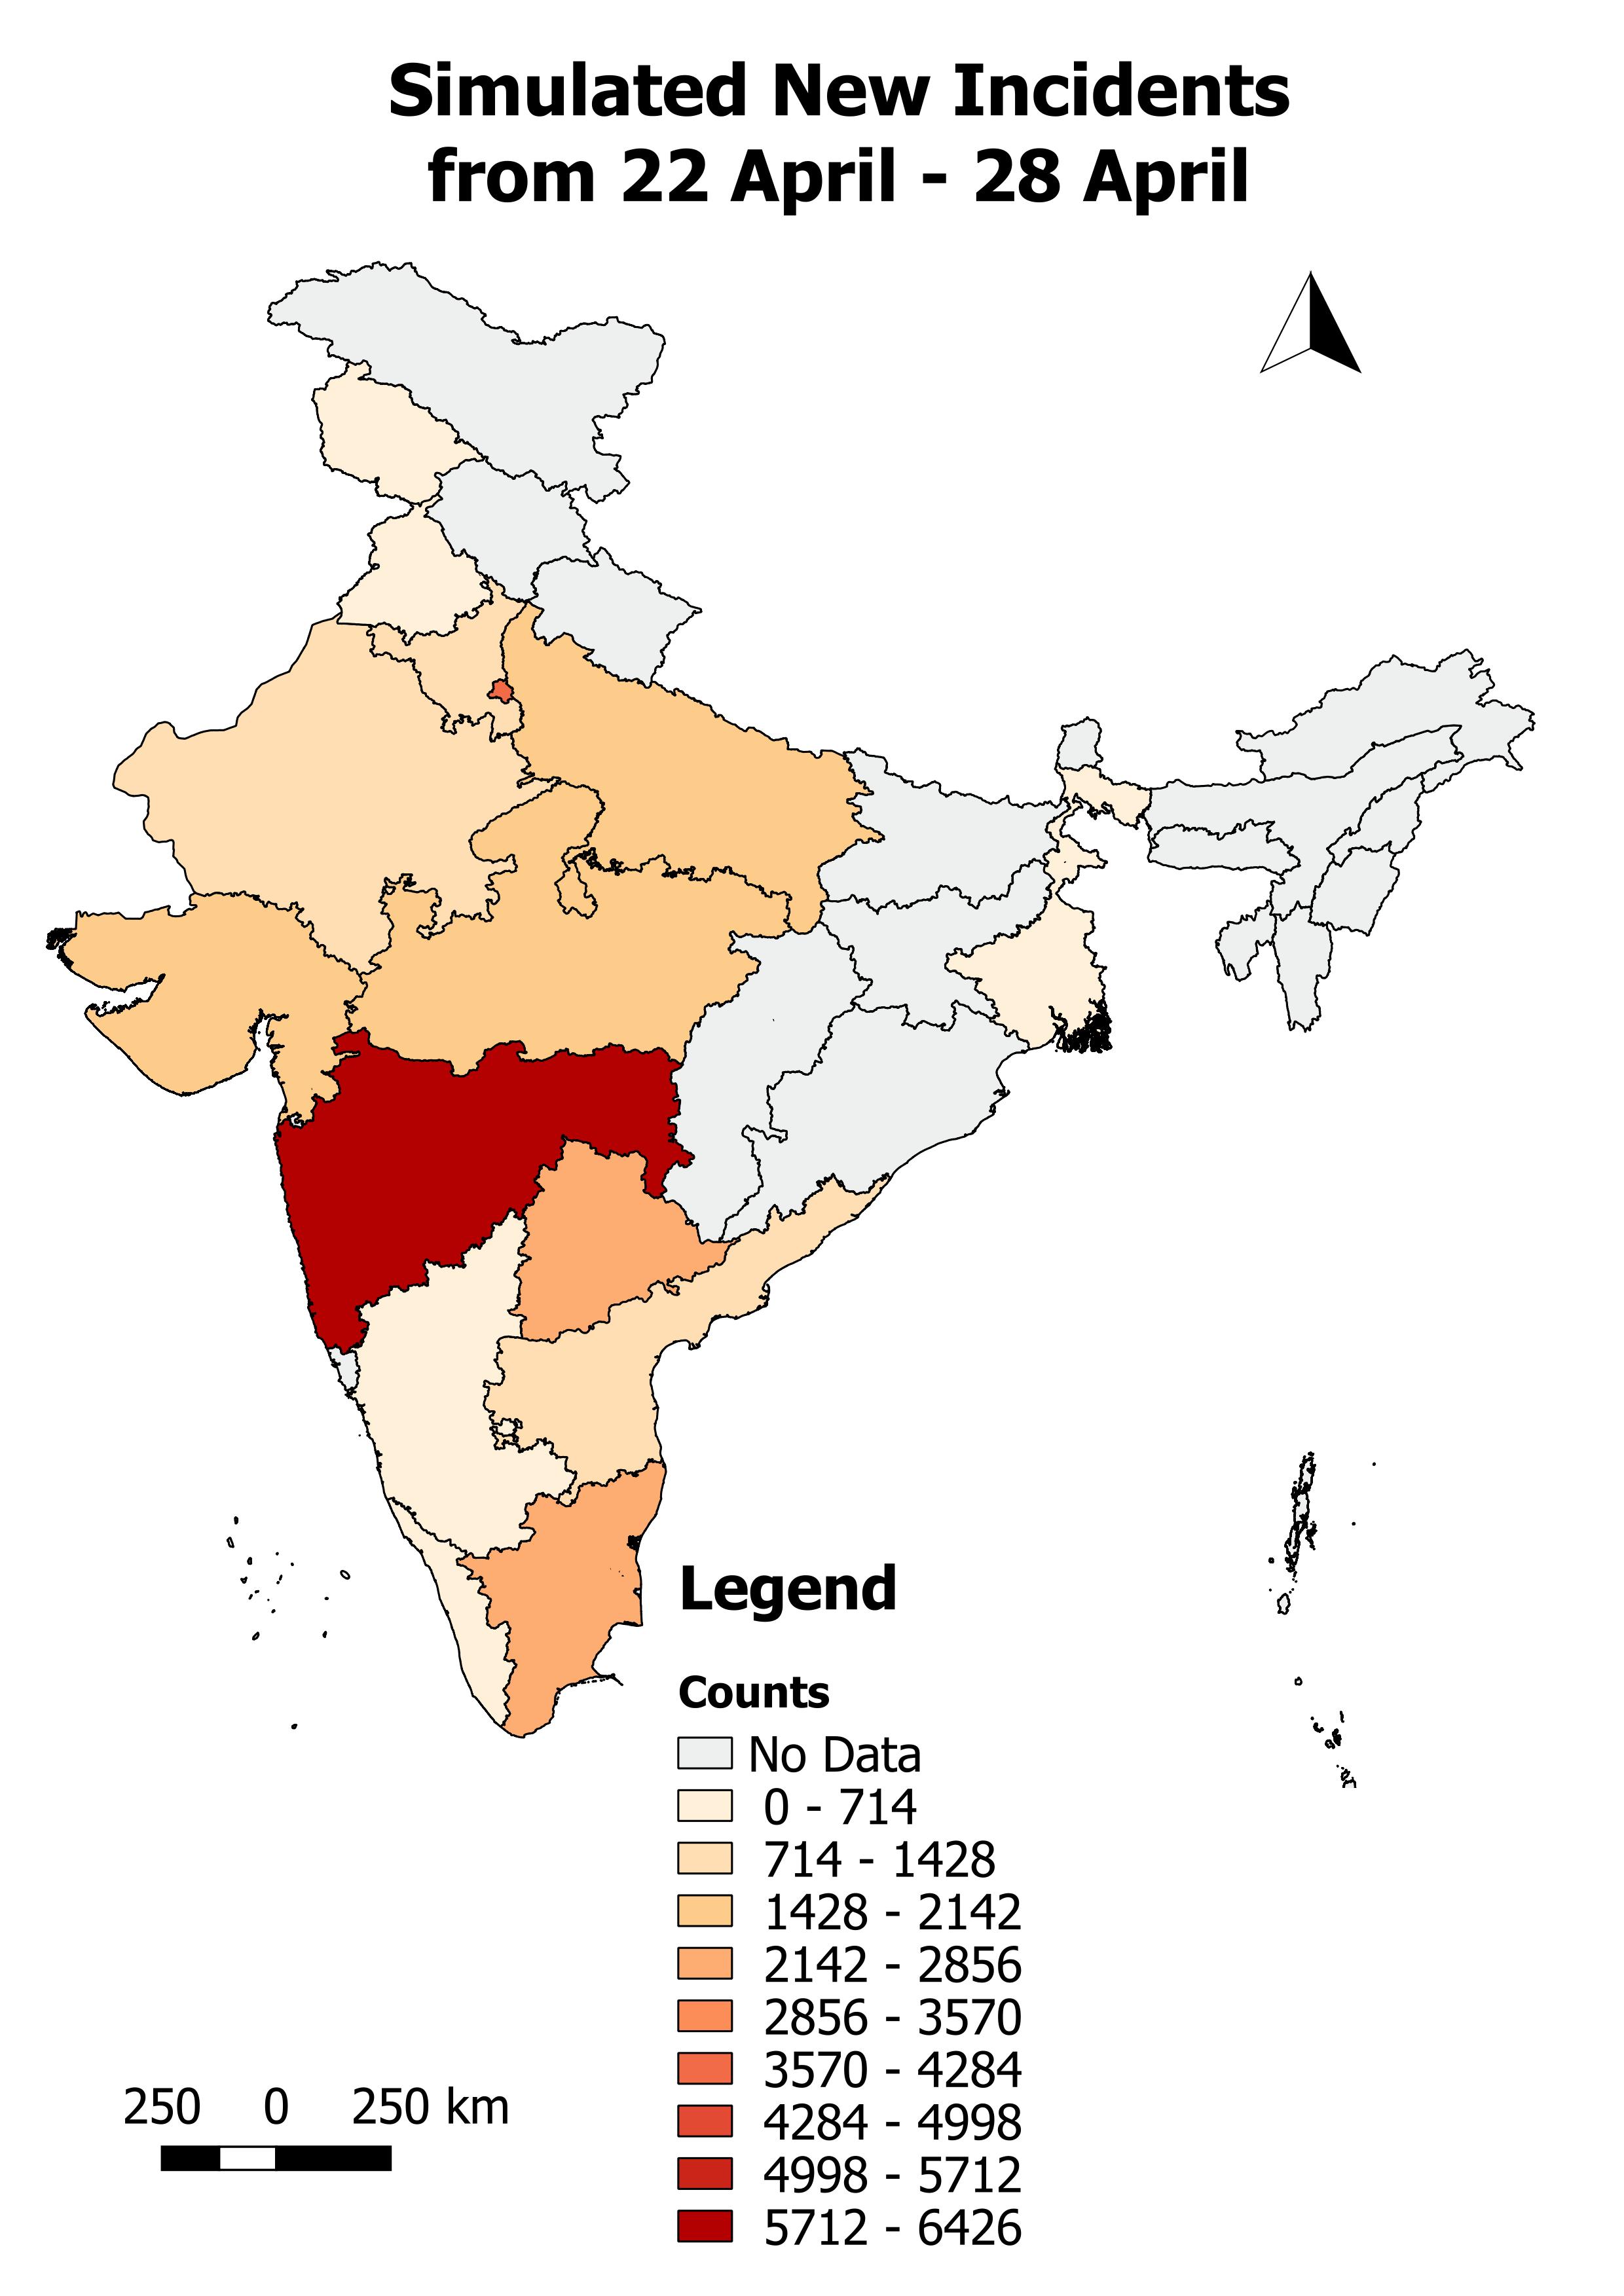 |
 |
|
12th April 2020 |
| 29 April - 5 May | 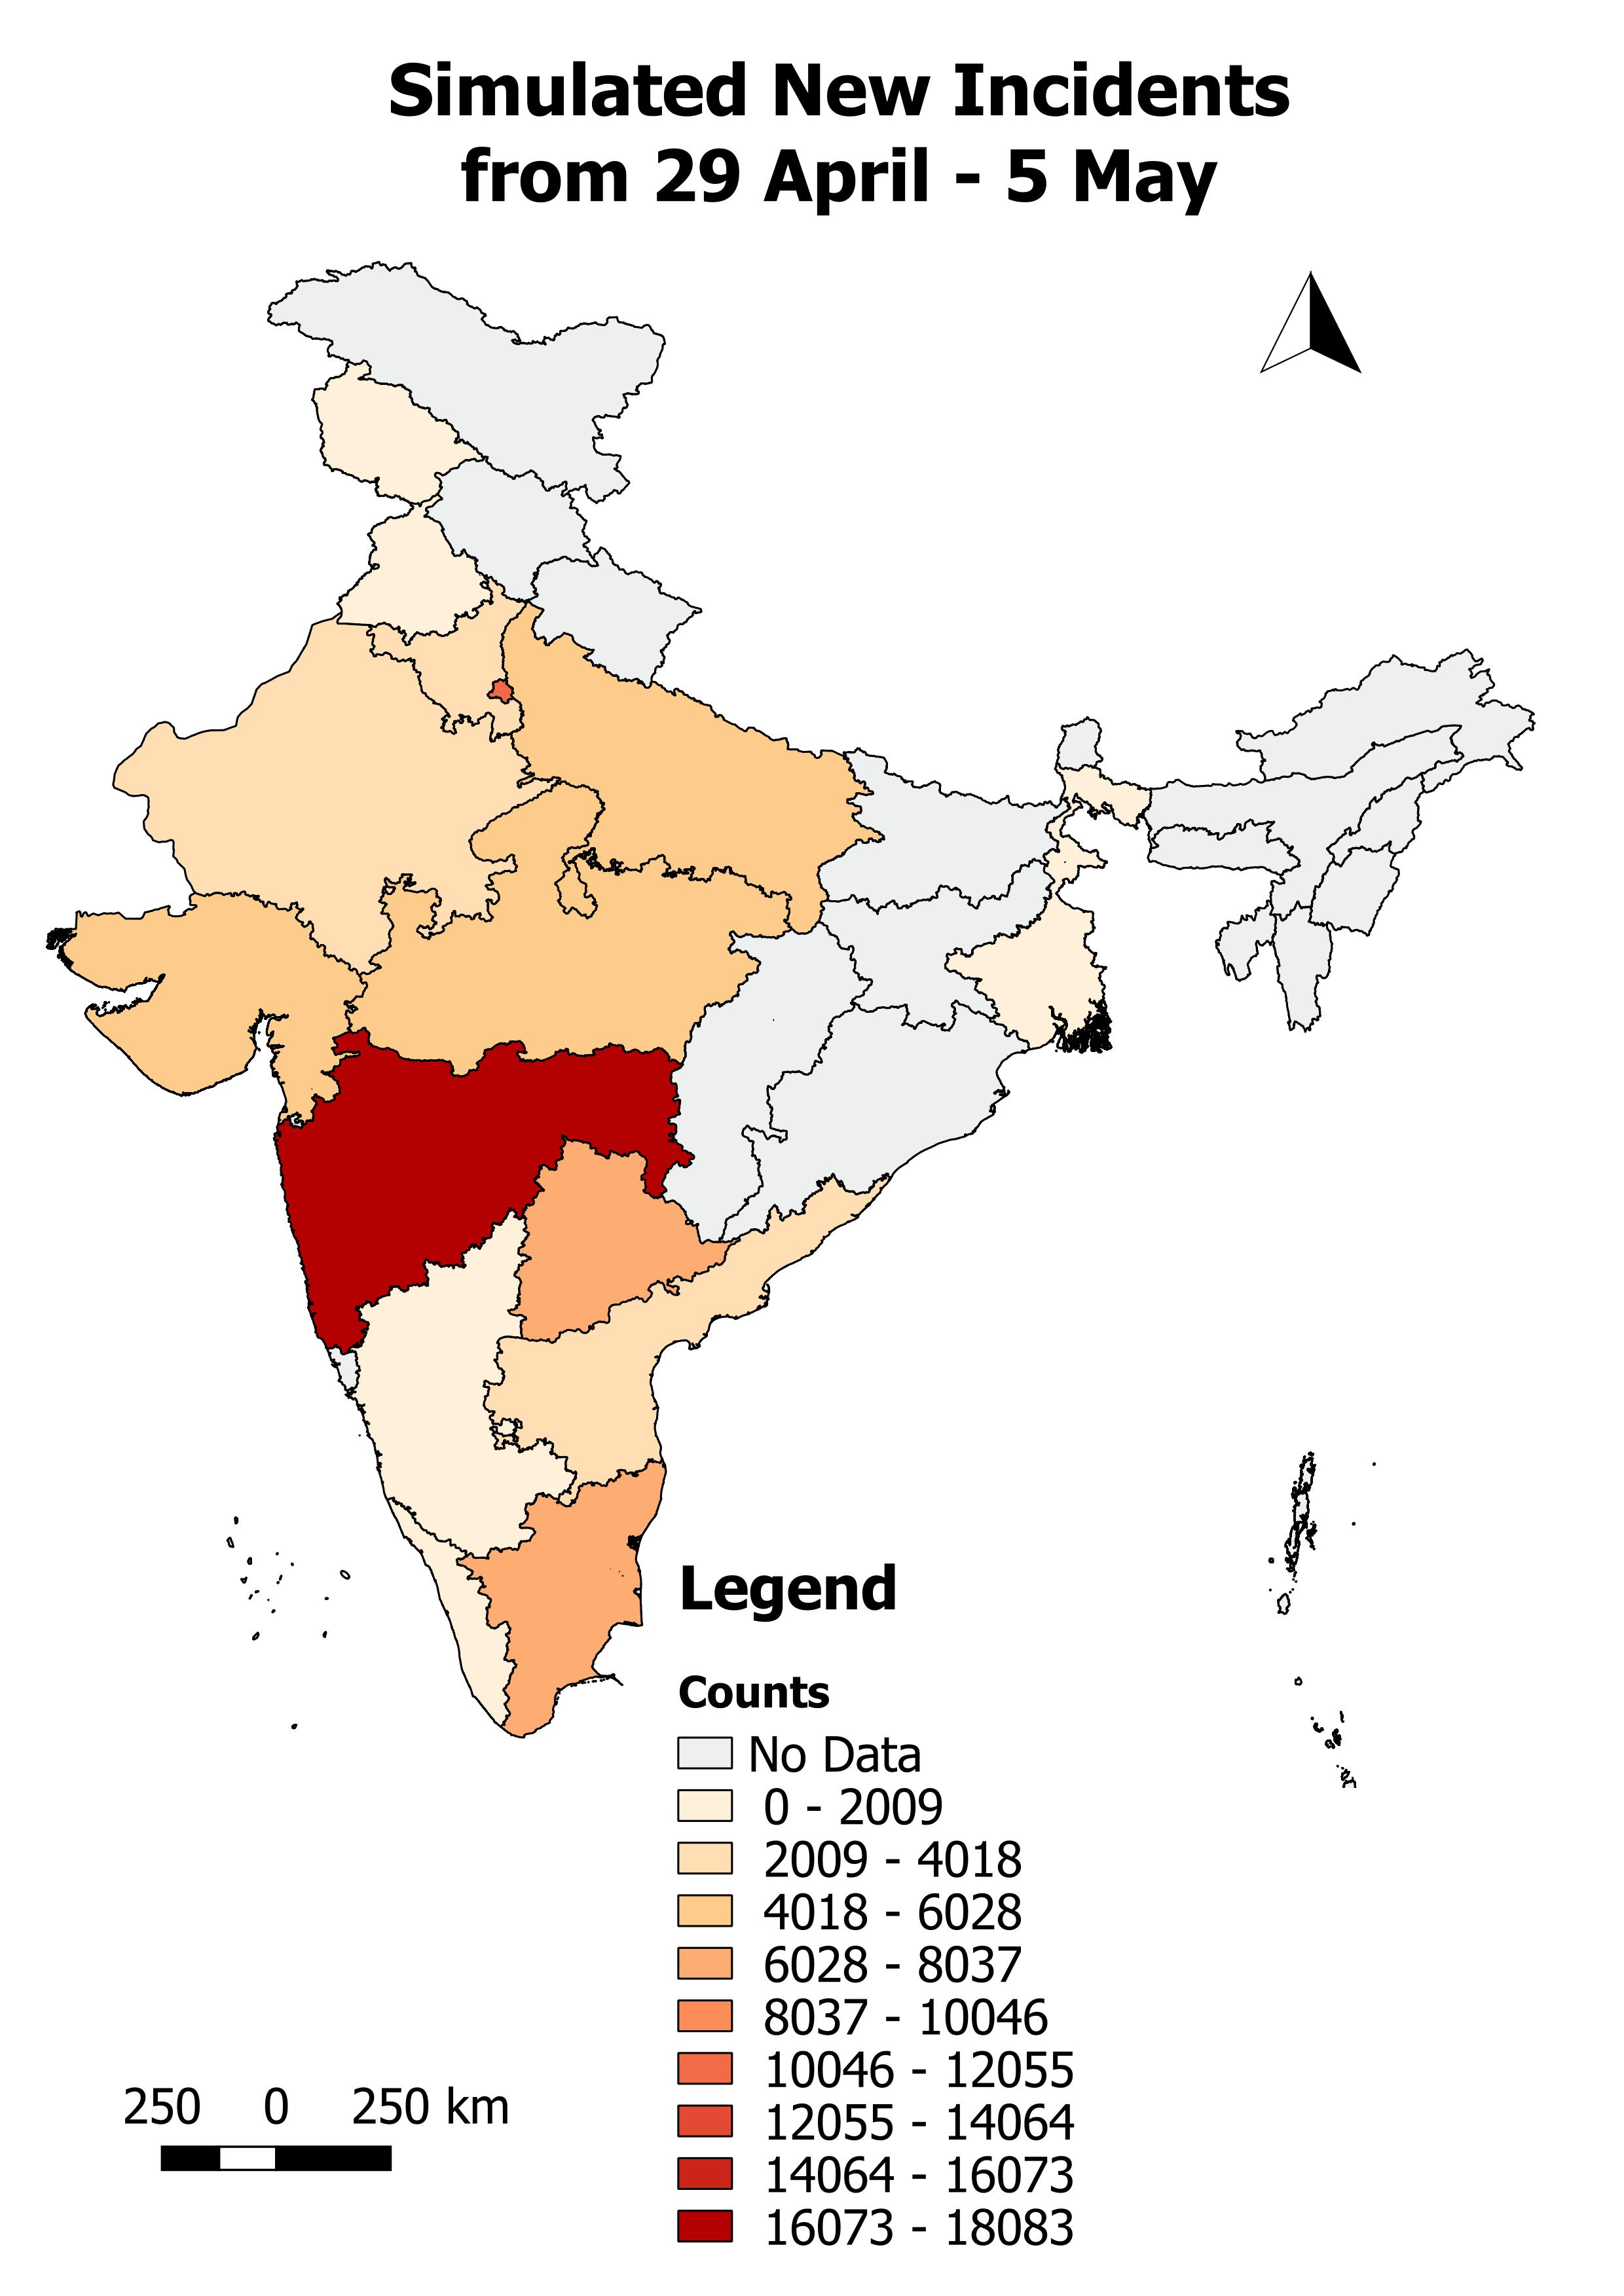 |
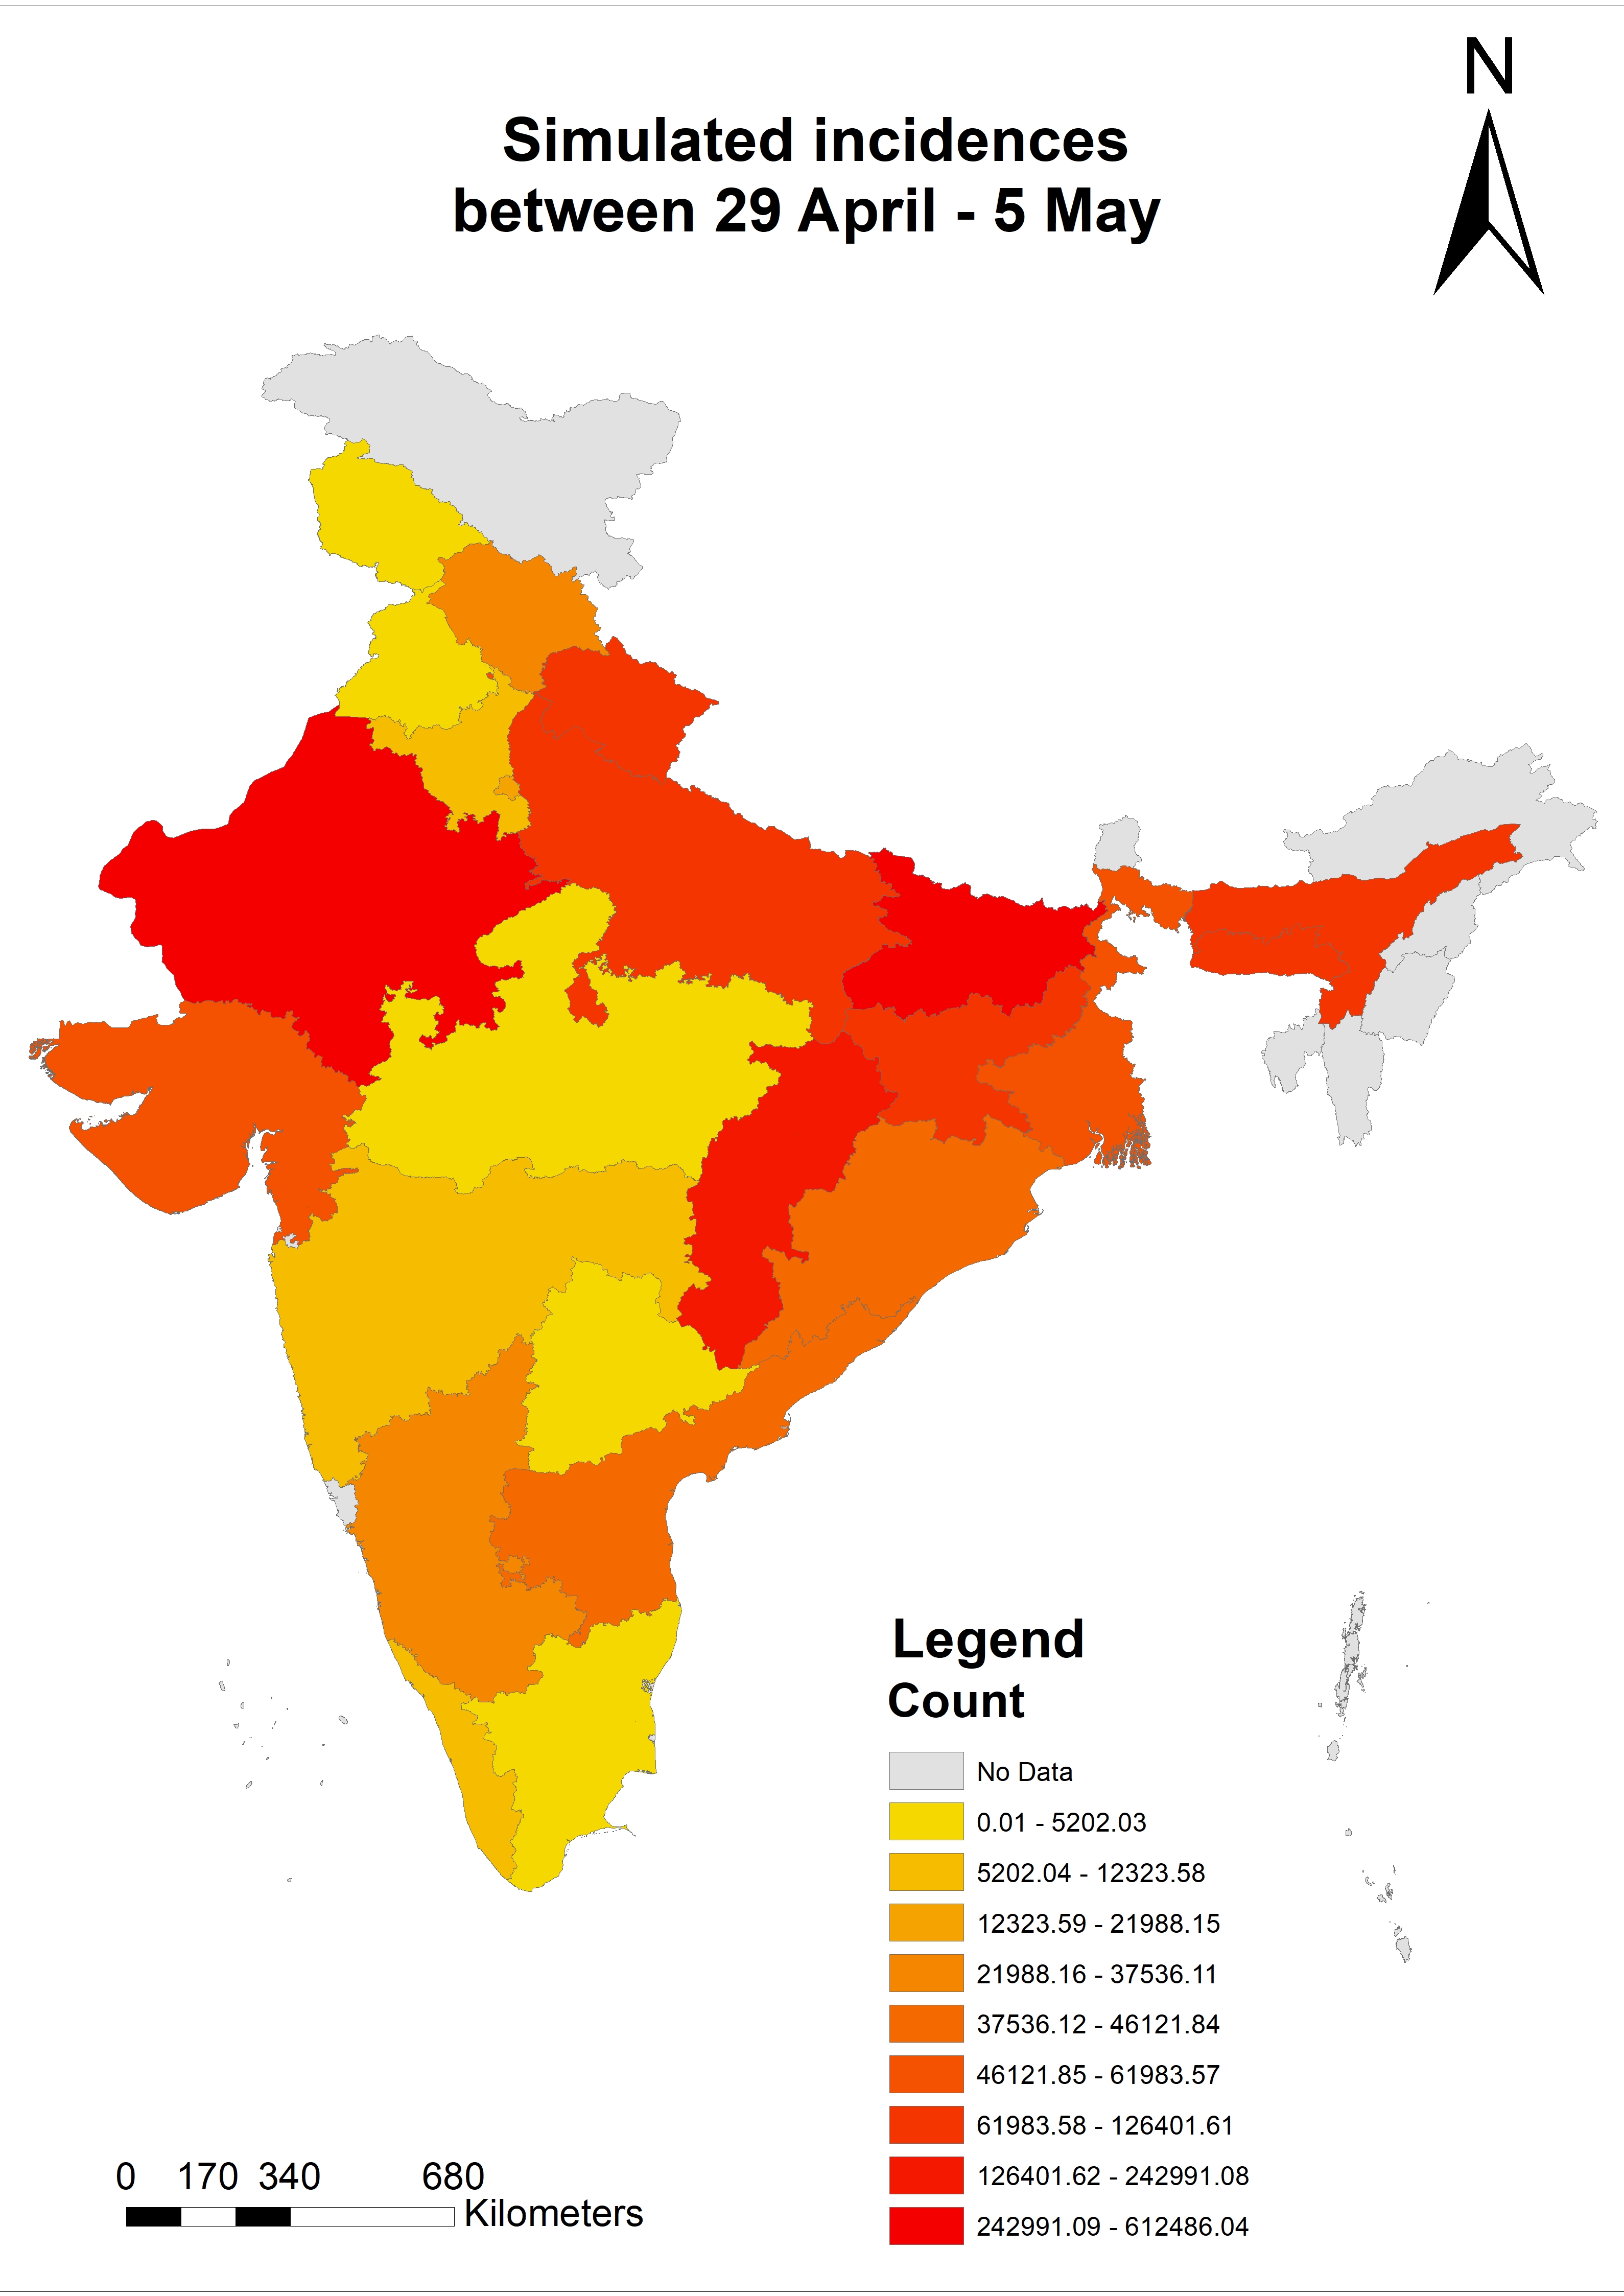 |
|
12th April 2020 |
| 6 May - 12 May | 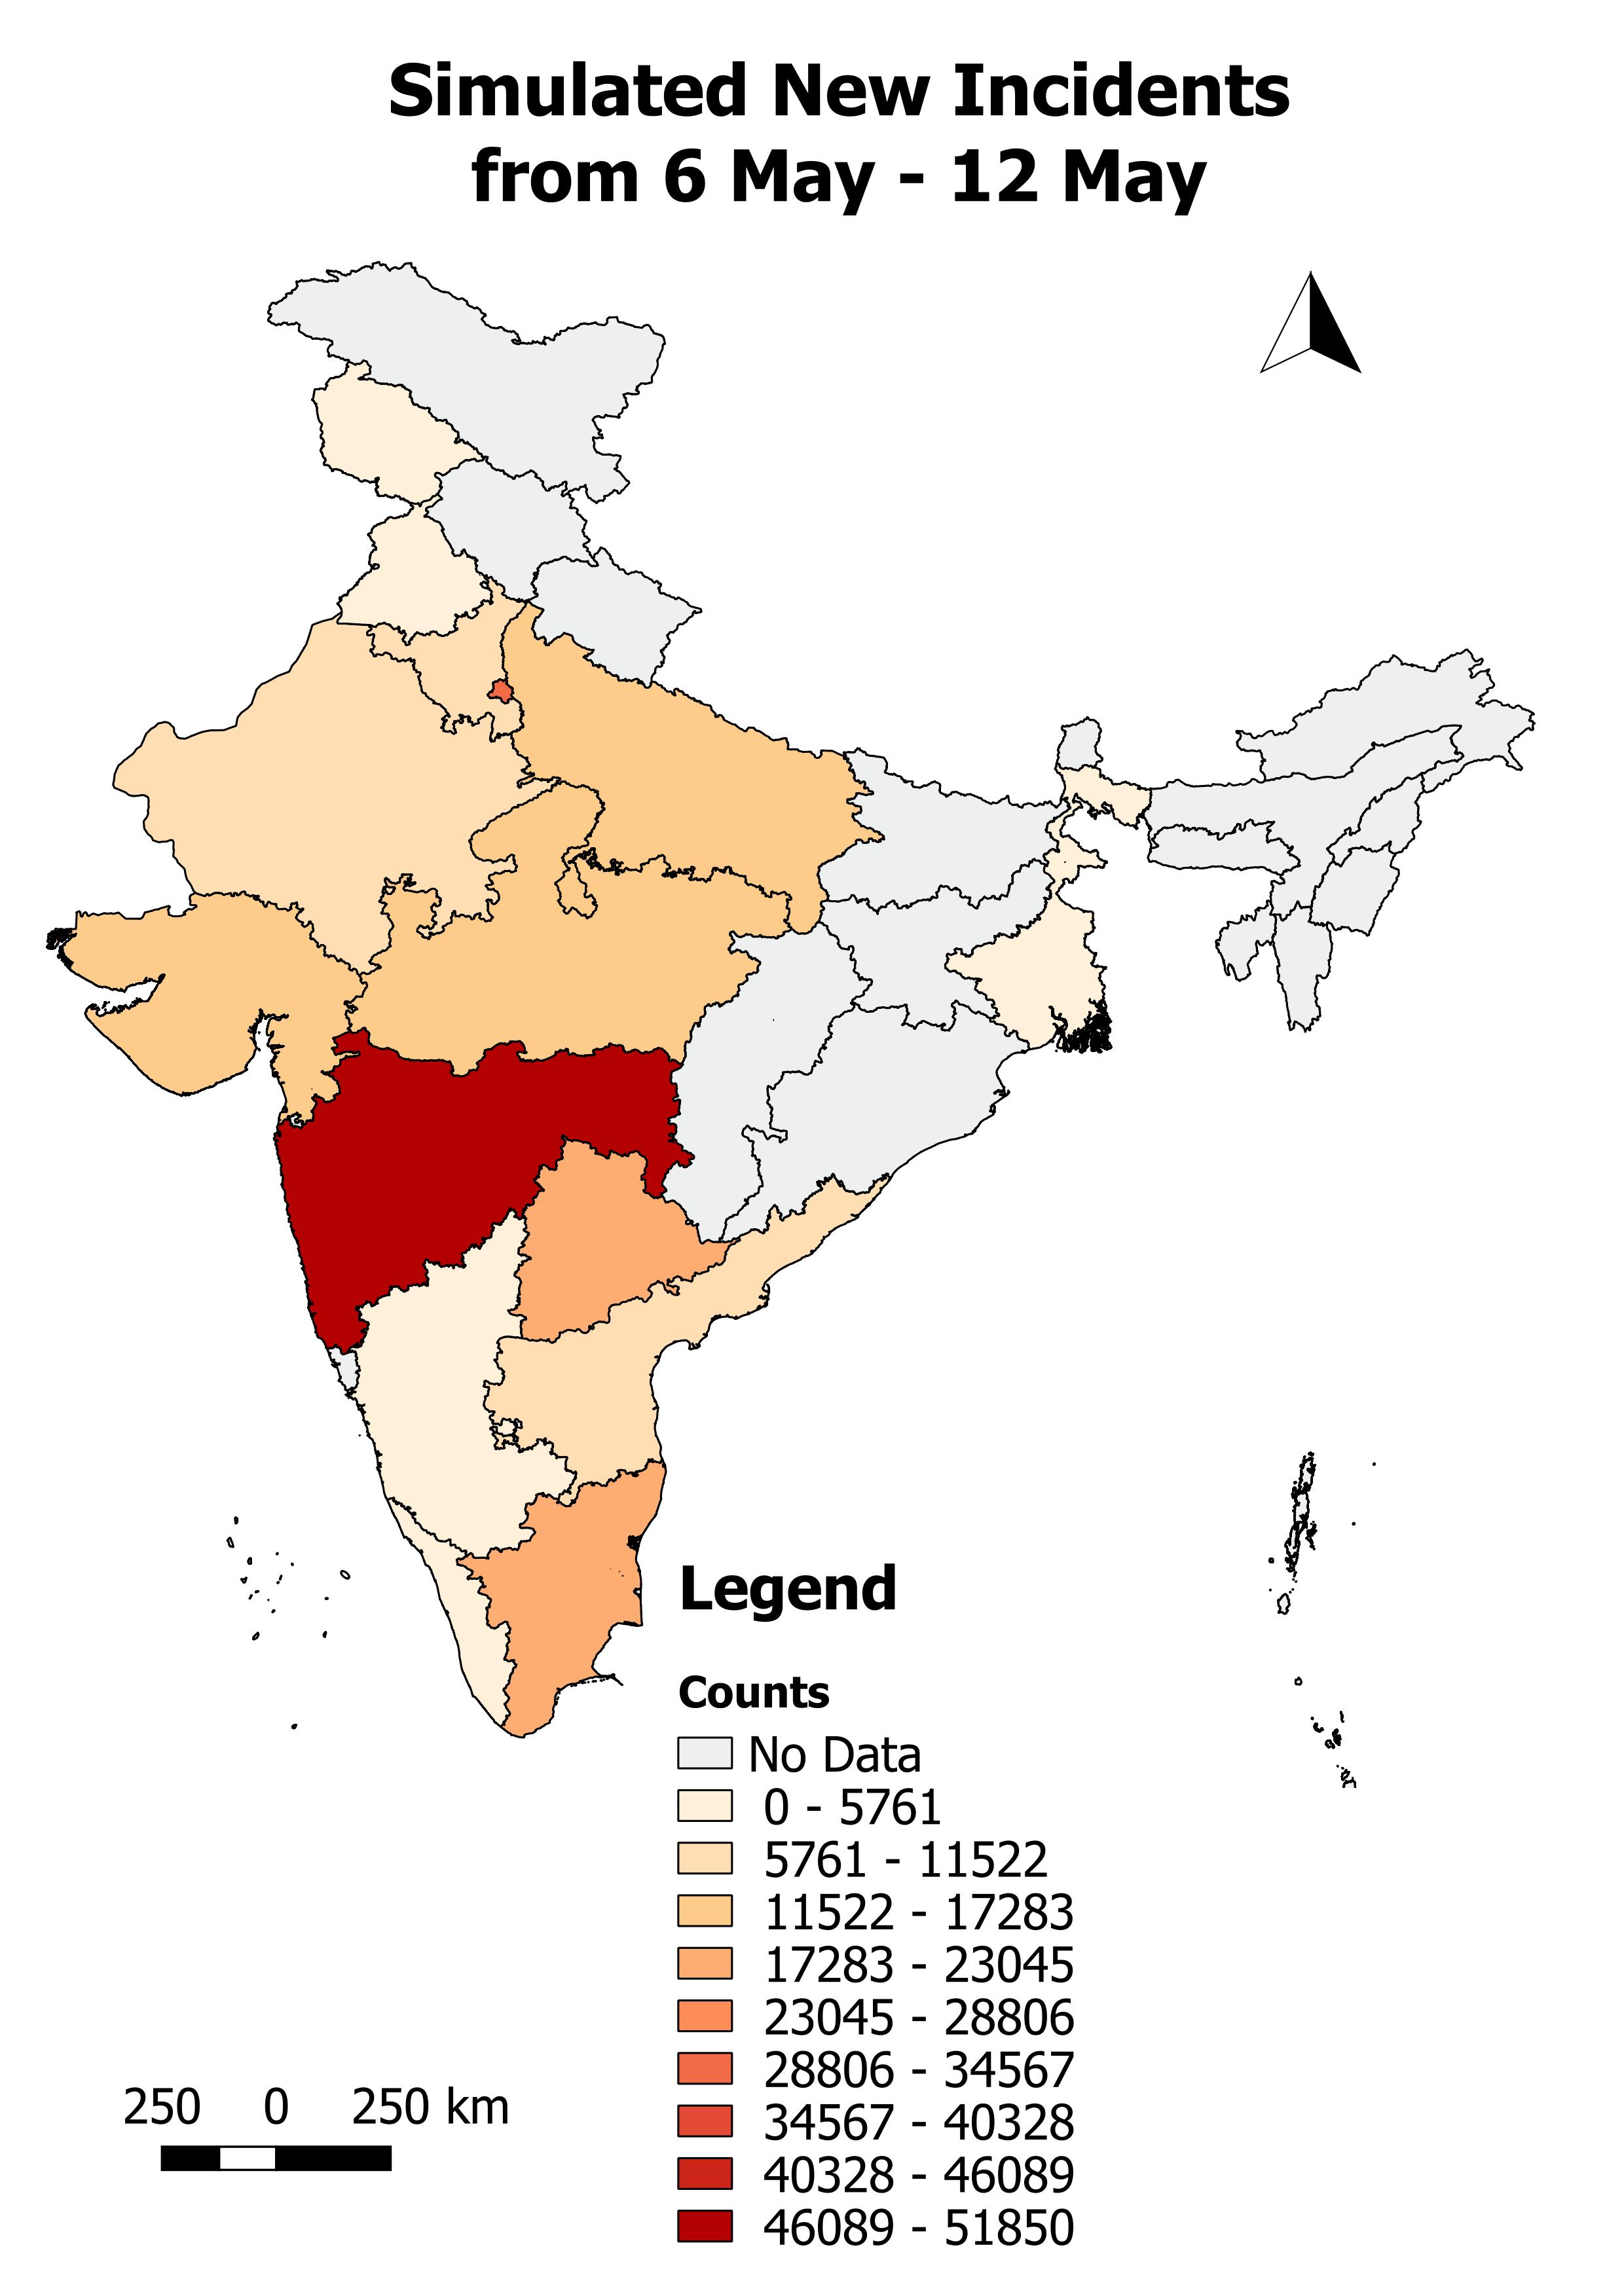 |
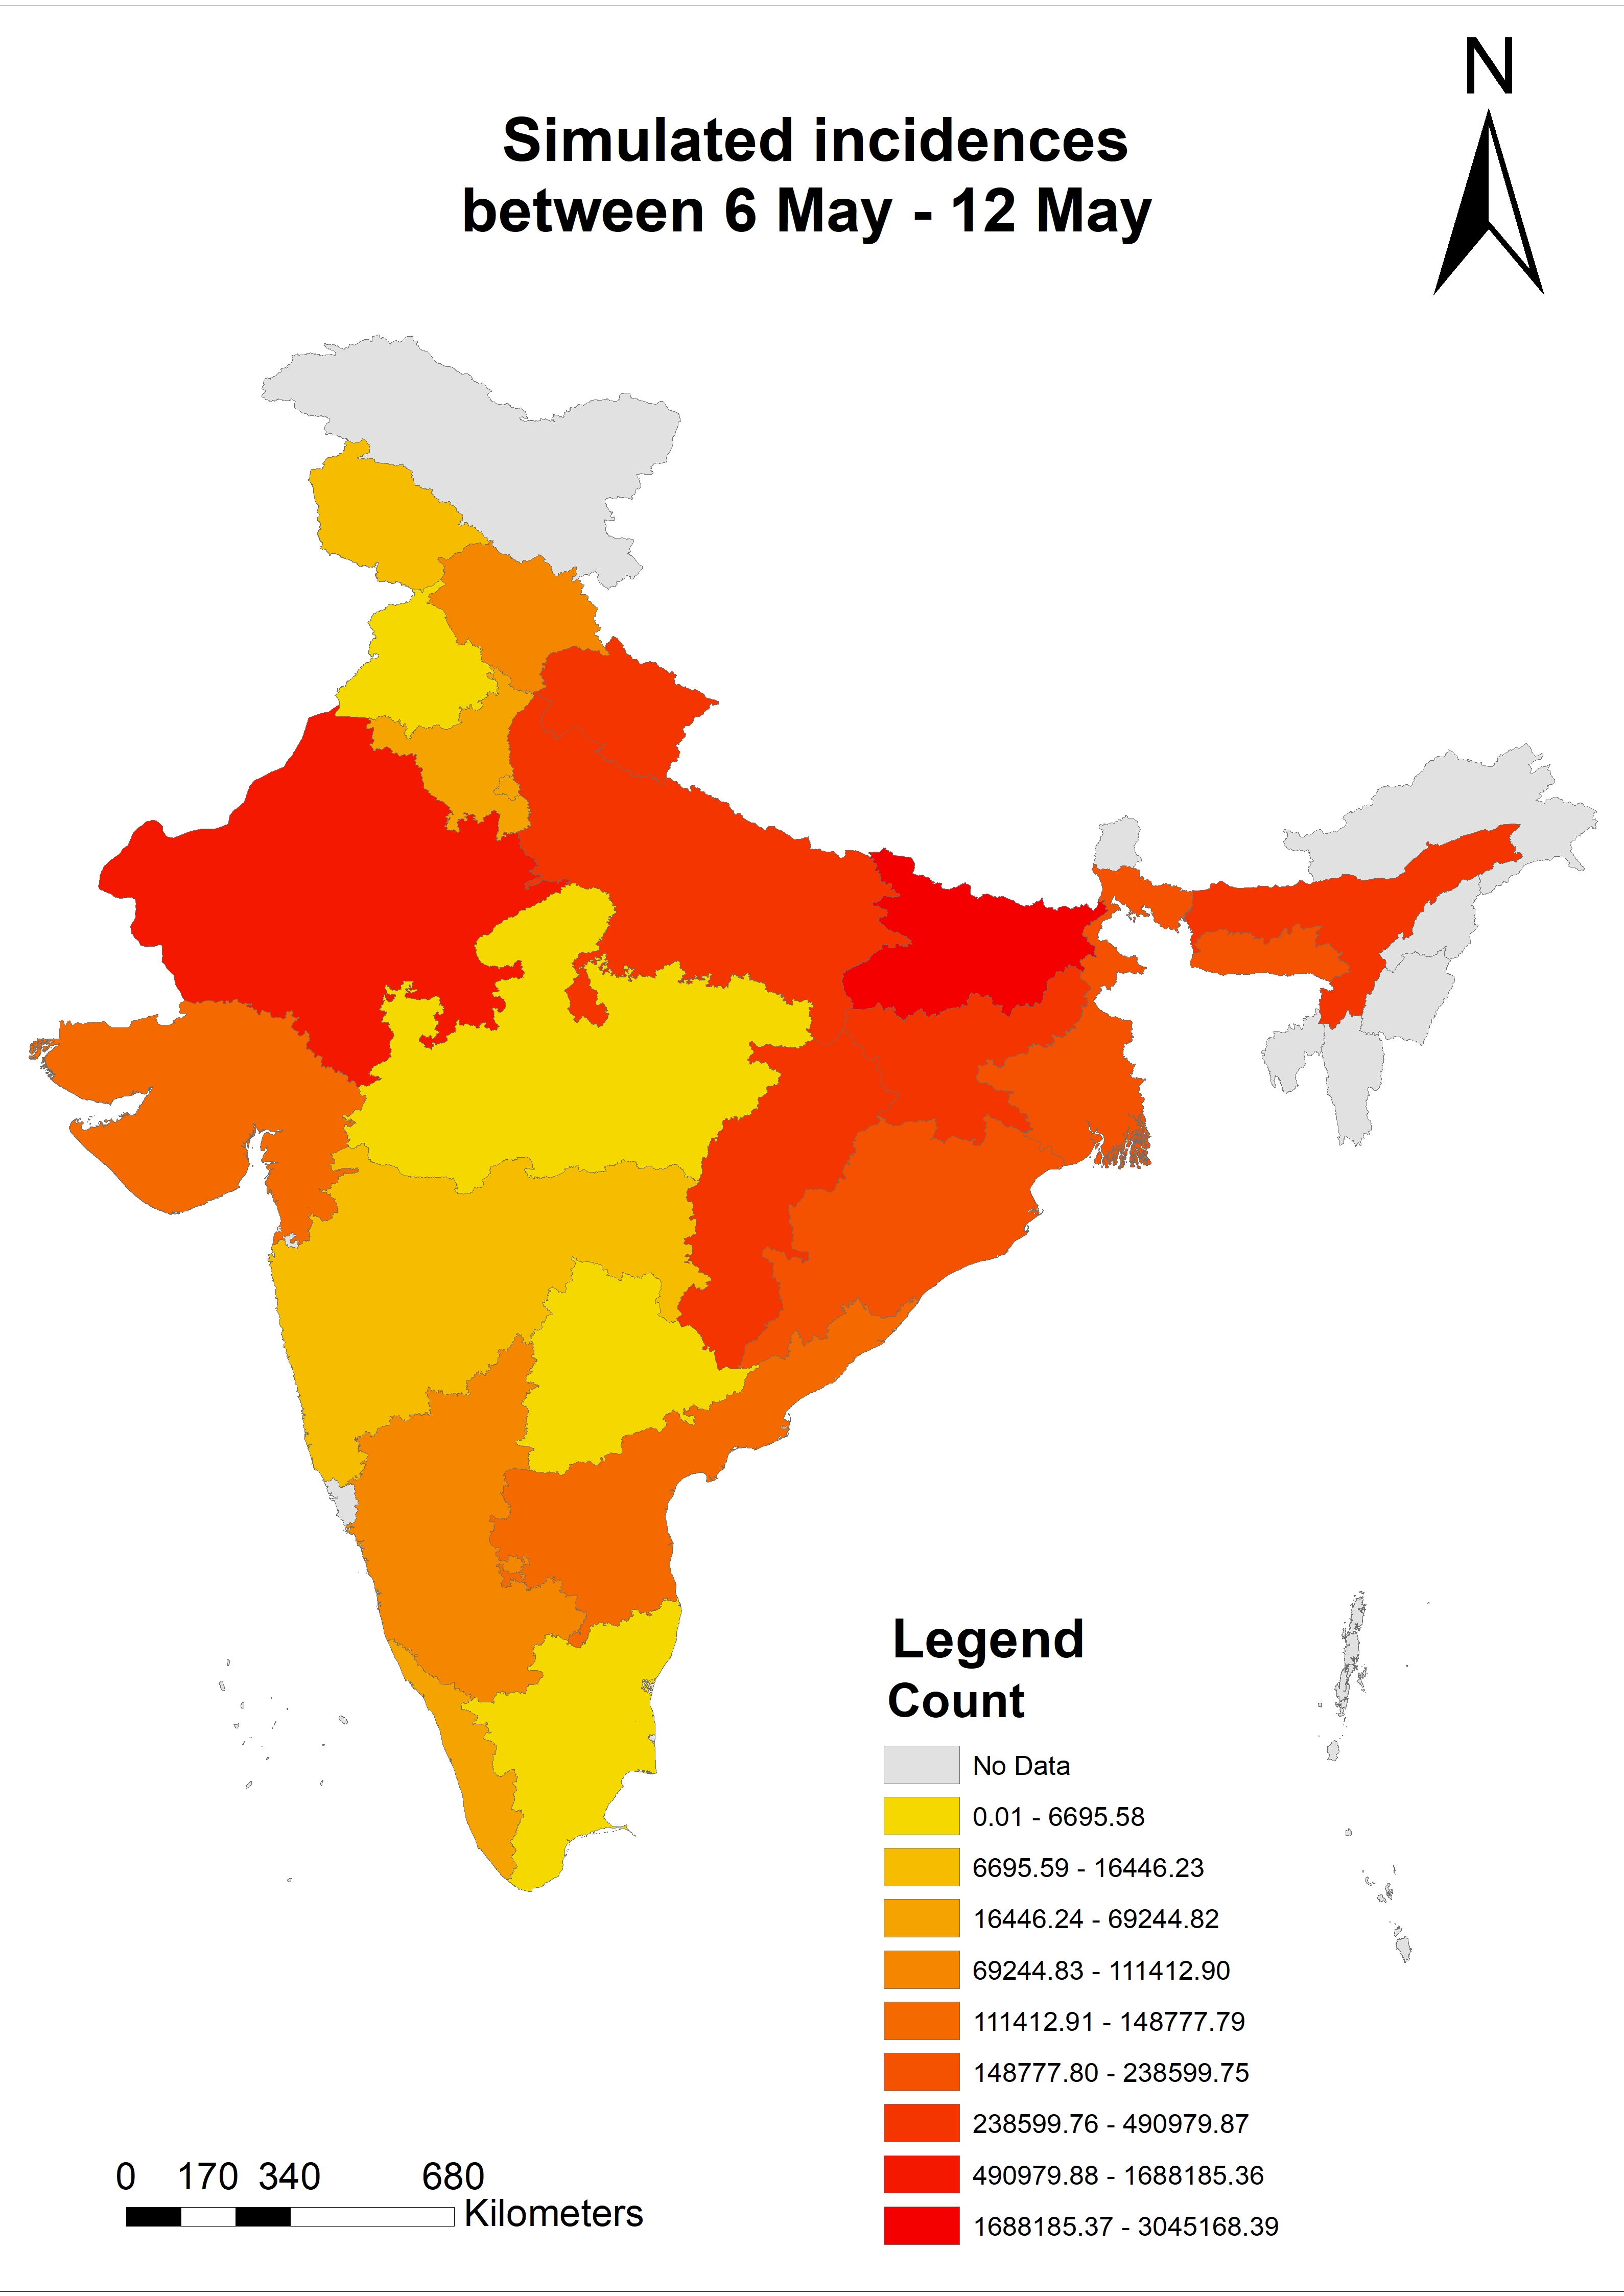 |
|
12th April 2020 |
| 13 May - 19 May | 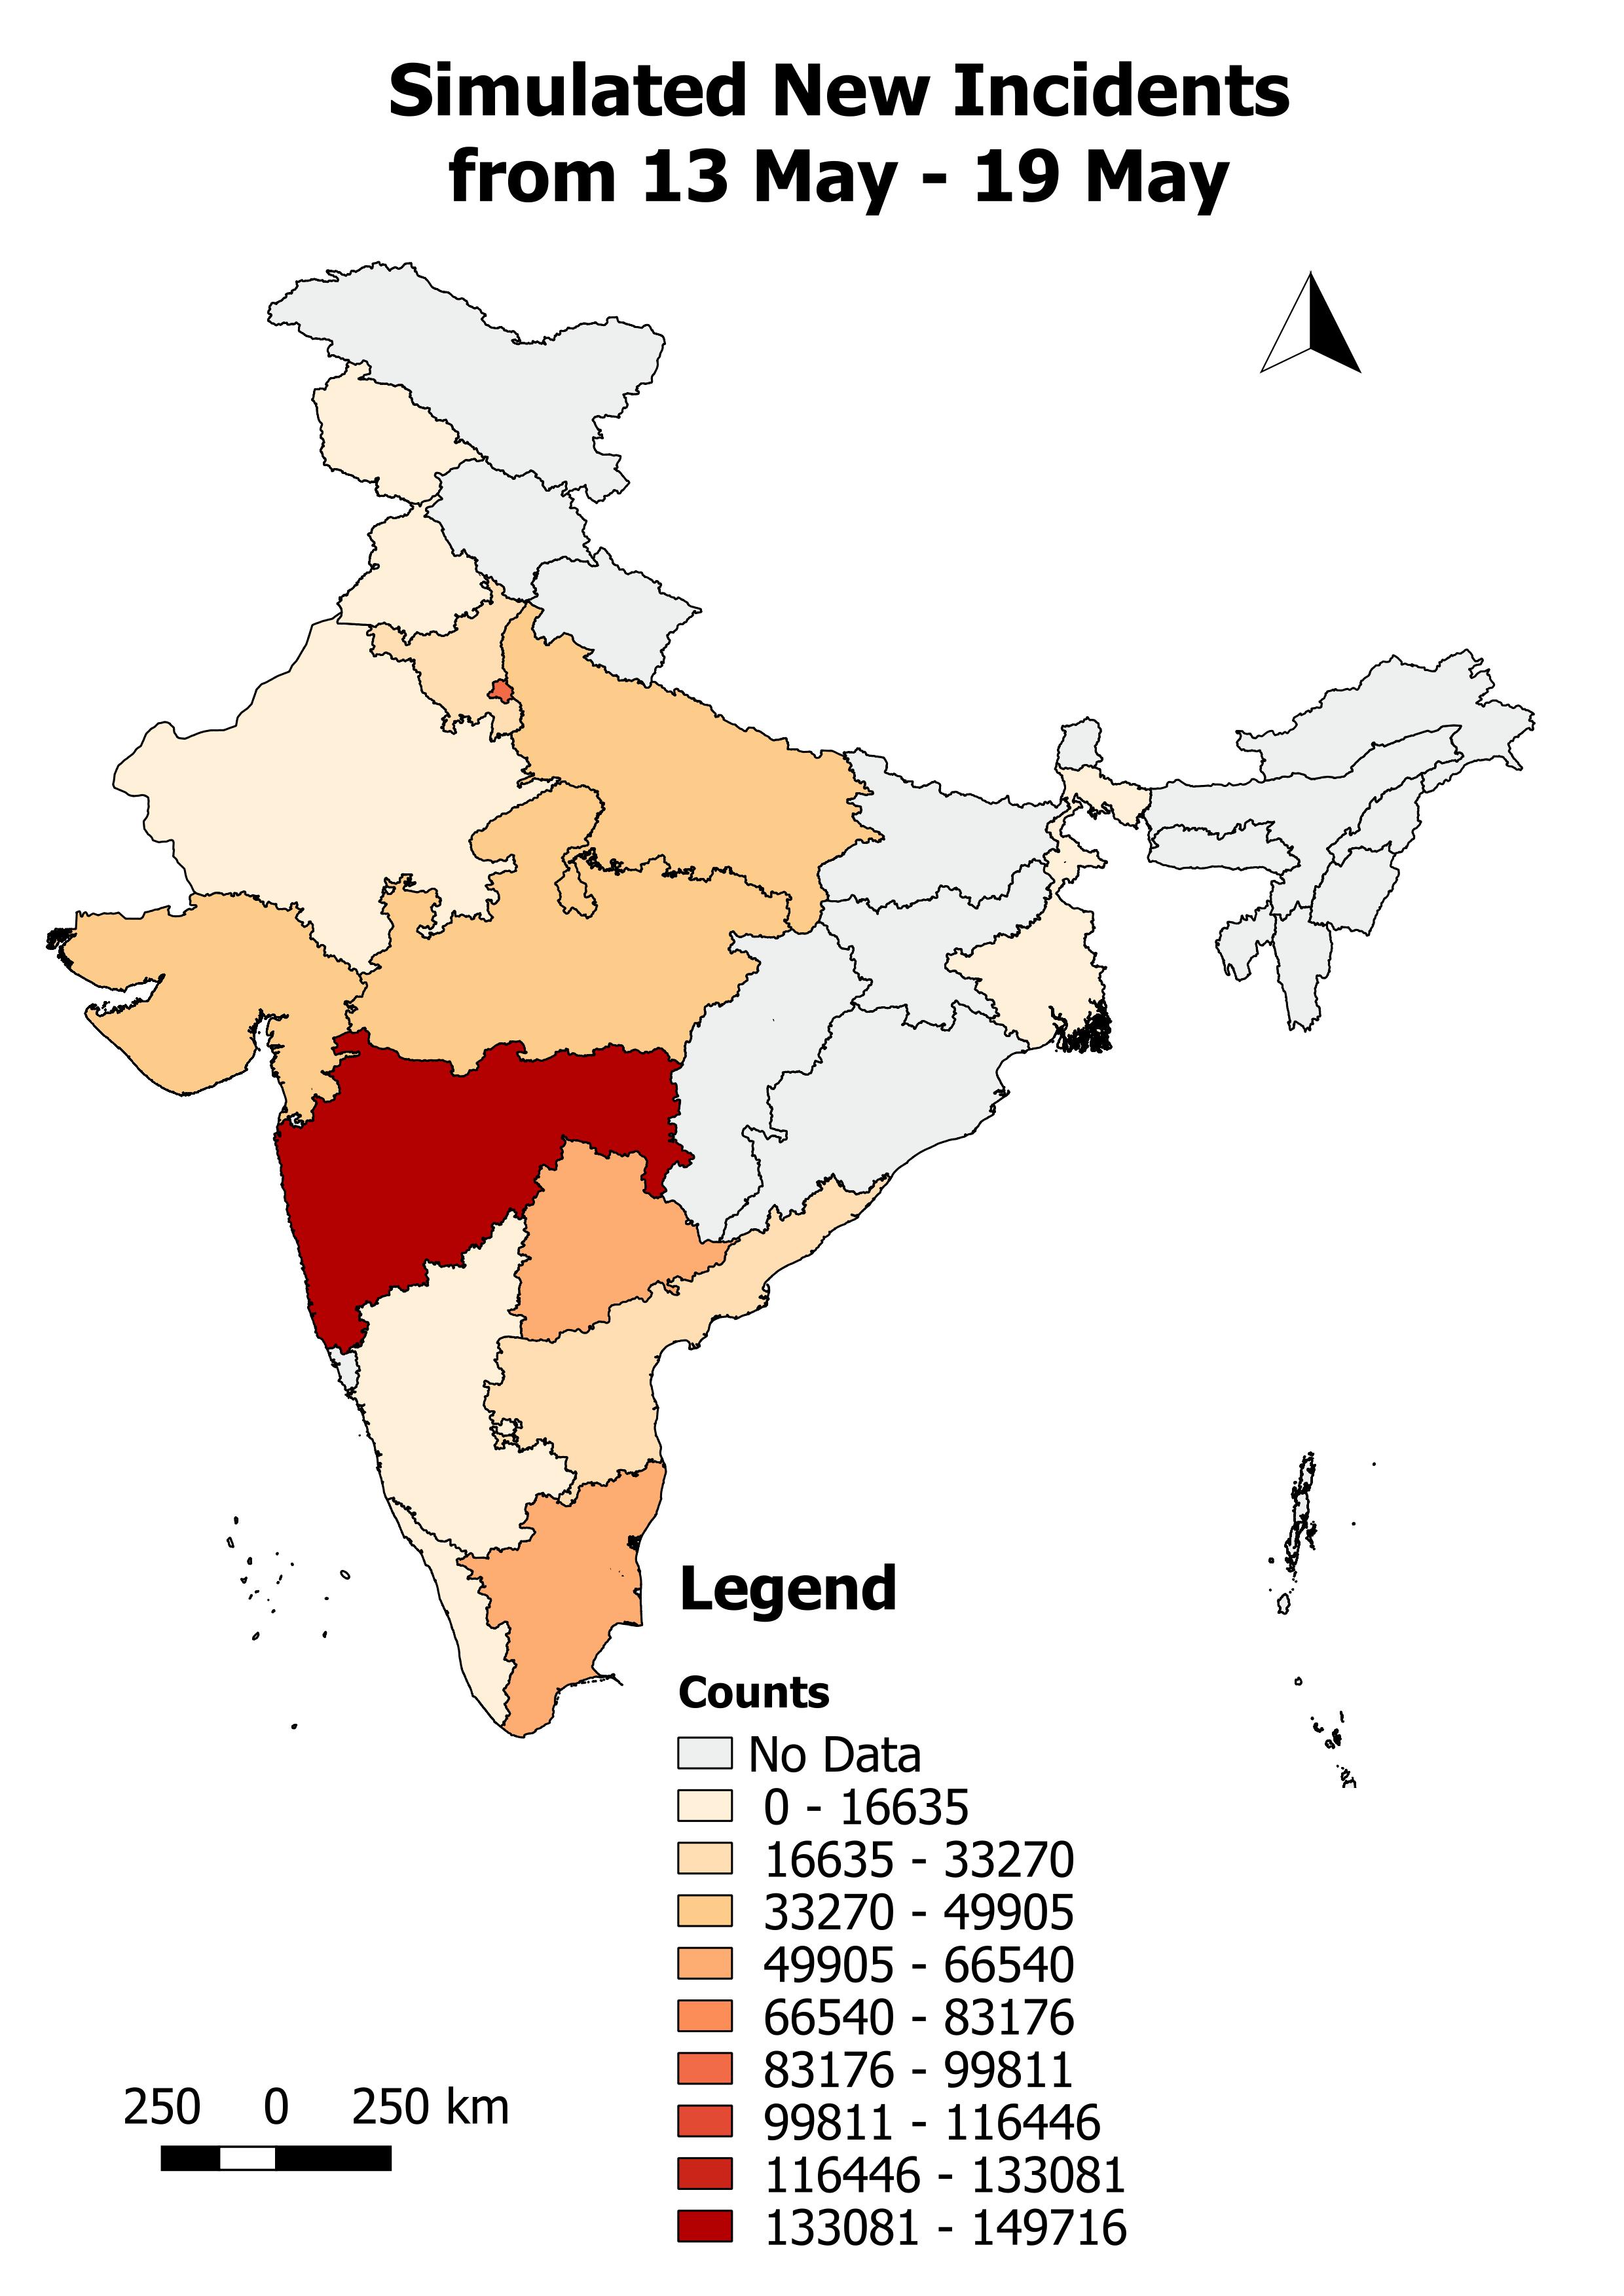 |
 |
|
12th April 2020 |
| 20 May - 26 May |  |
 |
|
12th April 2020 |
| 27 May - 2 June | 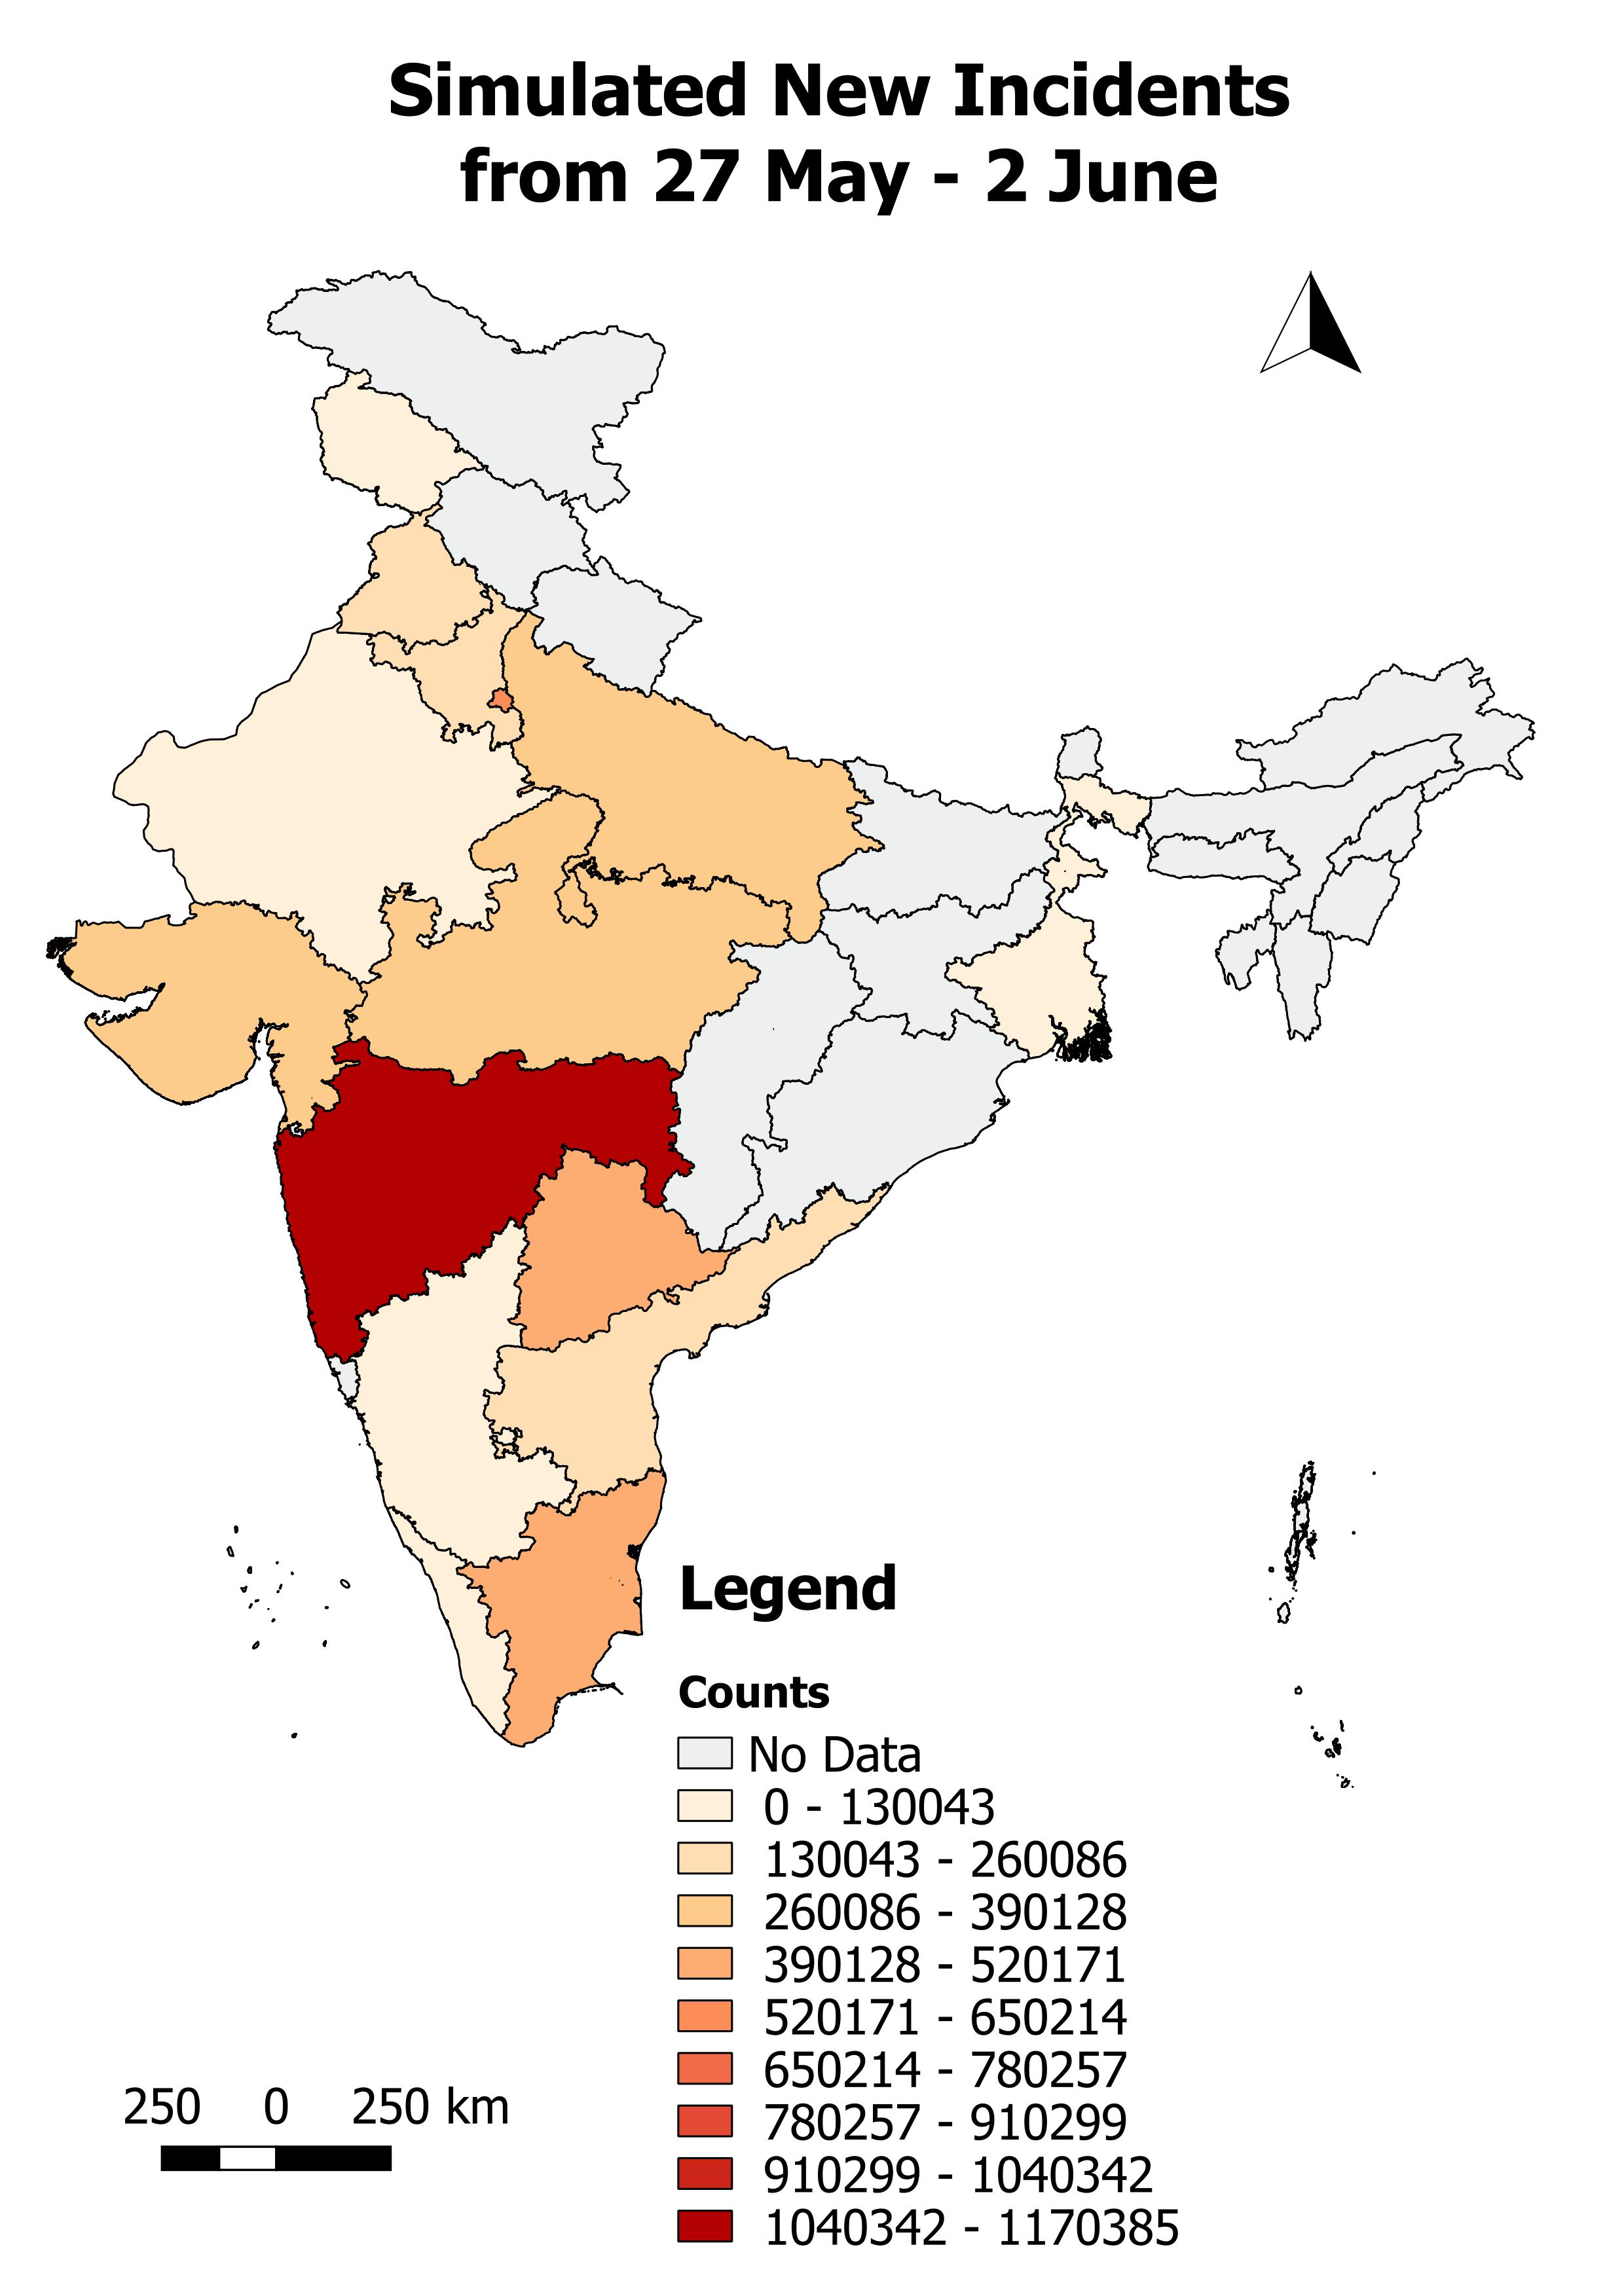 |
|
|
12th April 2020 |
| 3 June - 9 June | 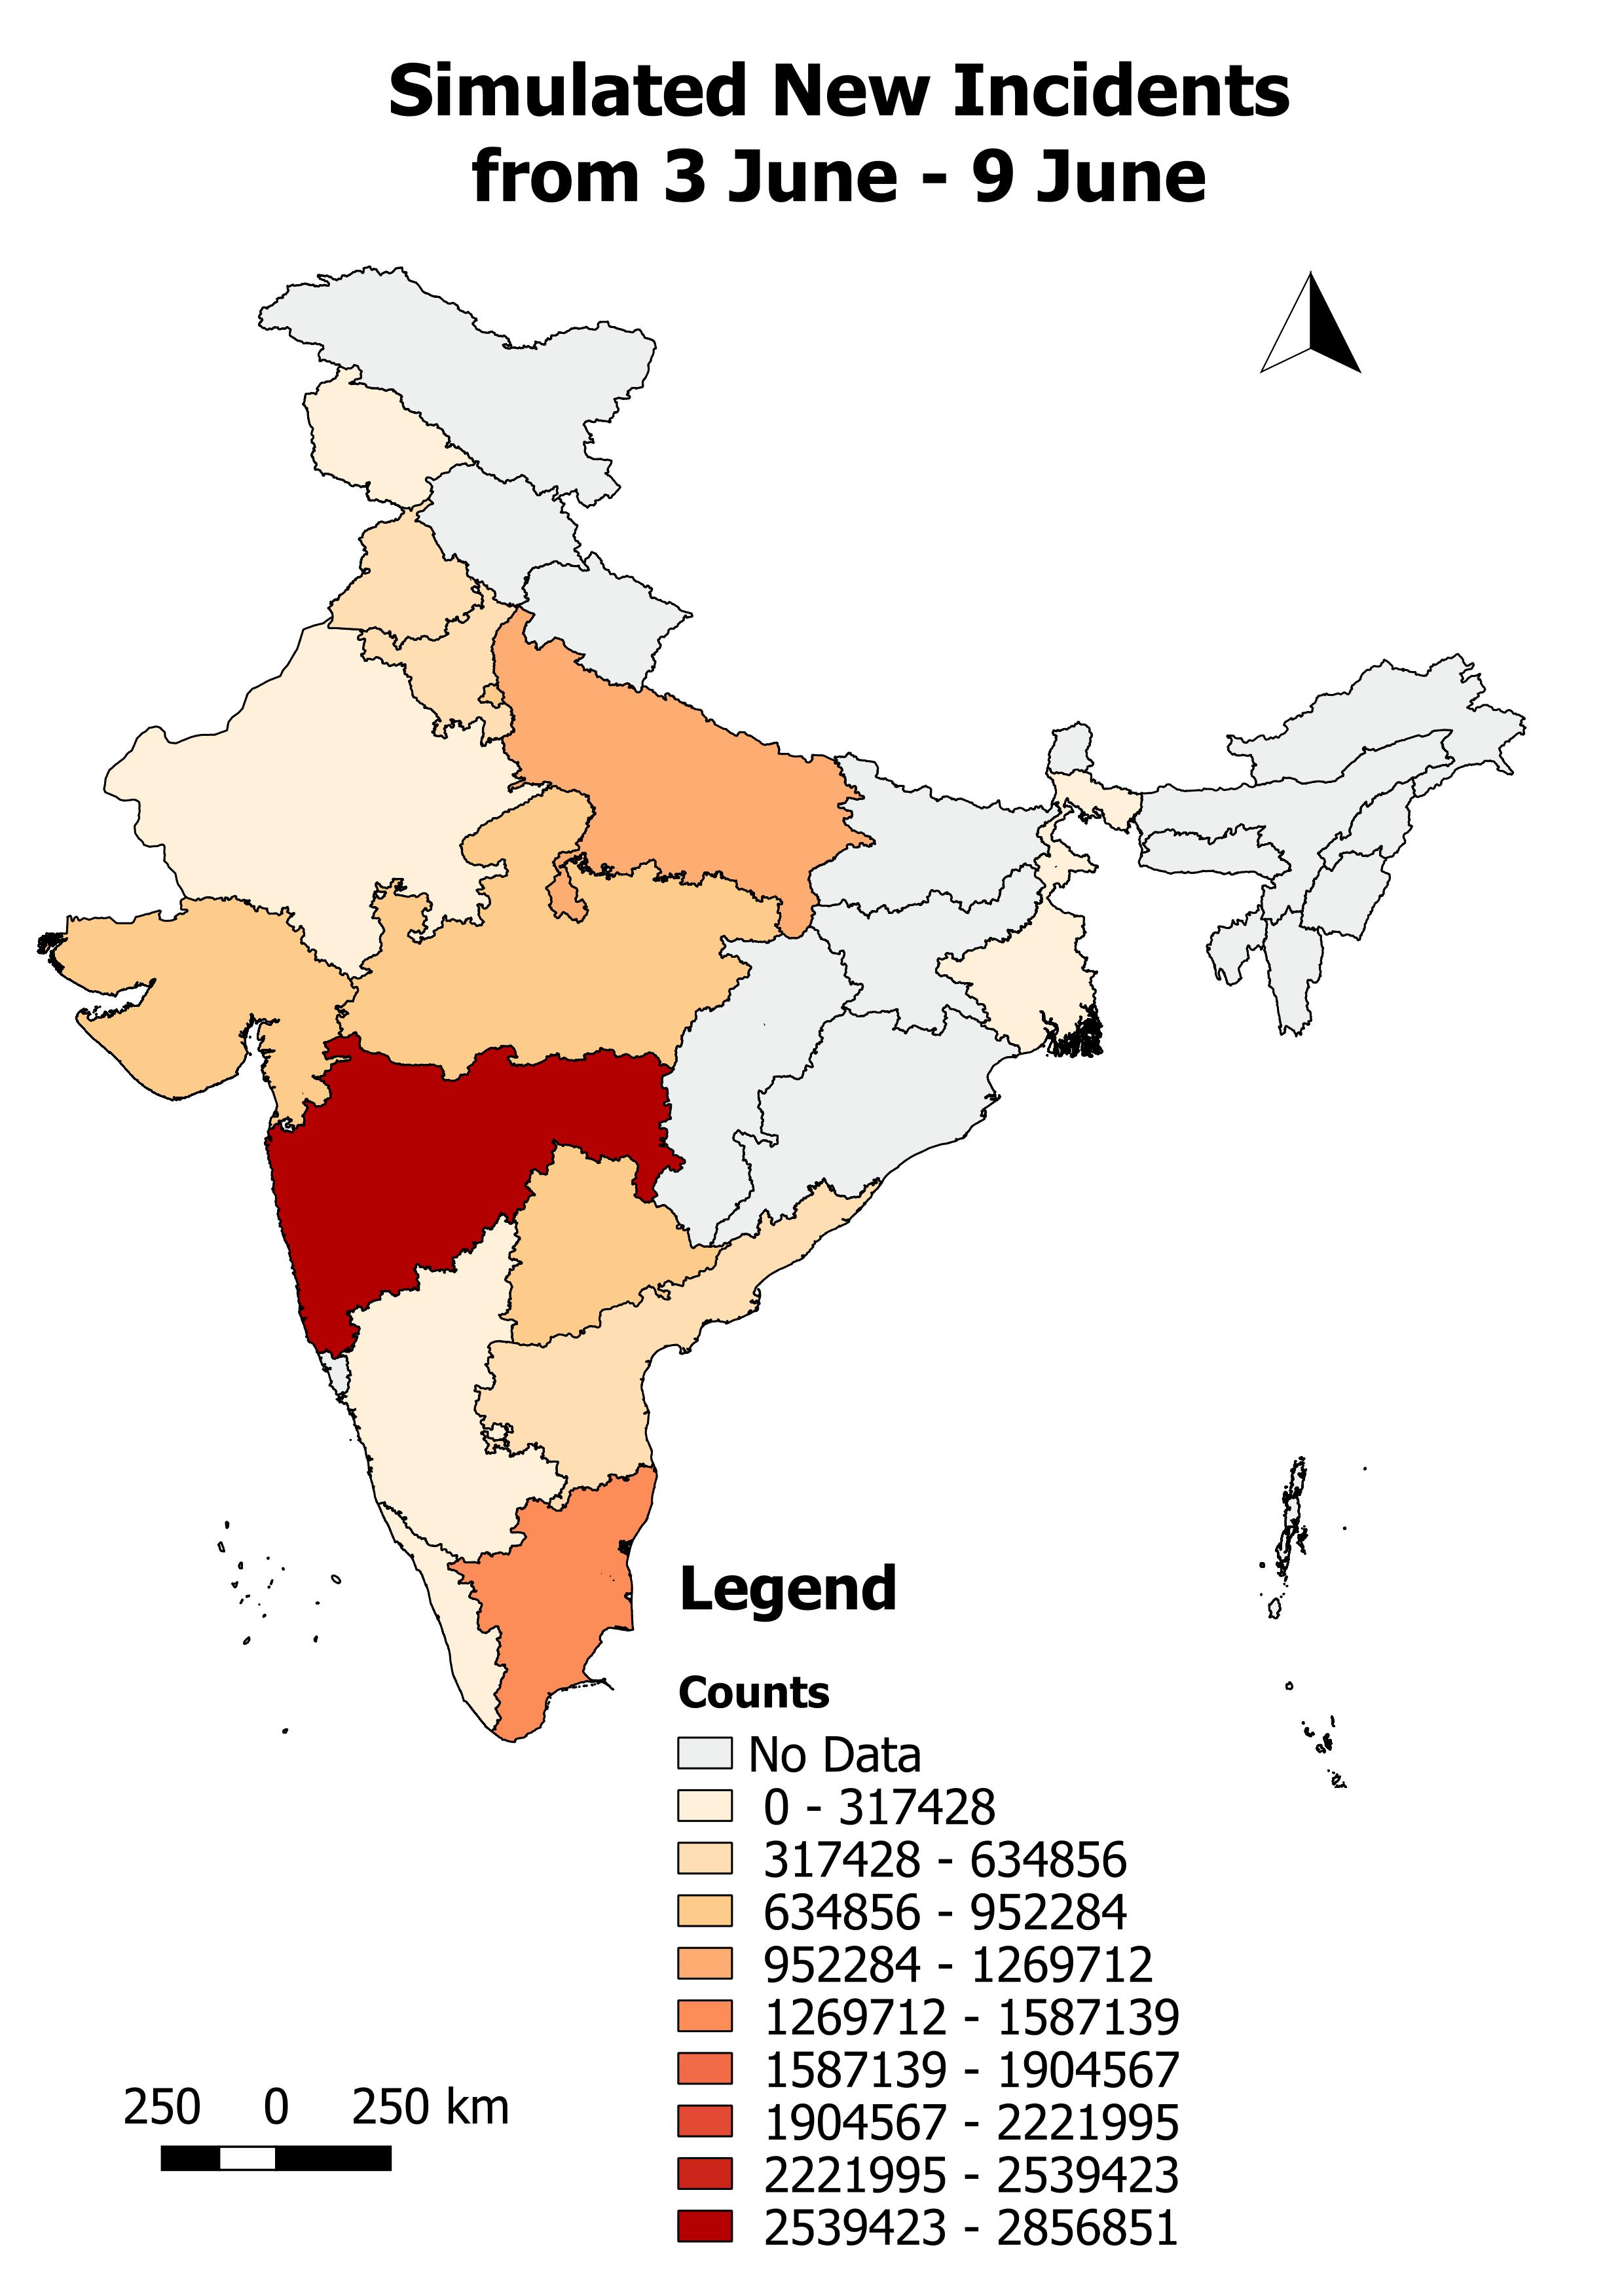 |
|
|
12th April 2020 |
| 10 June - 16 June | 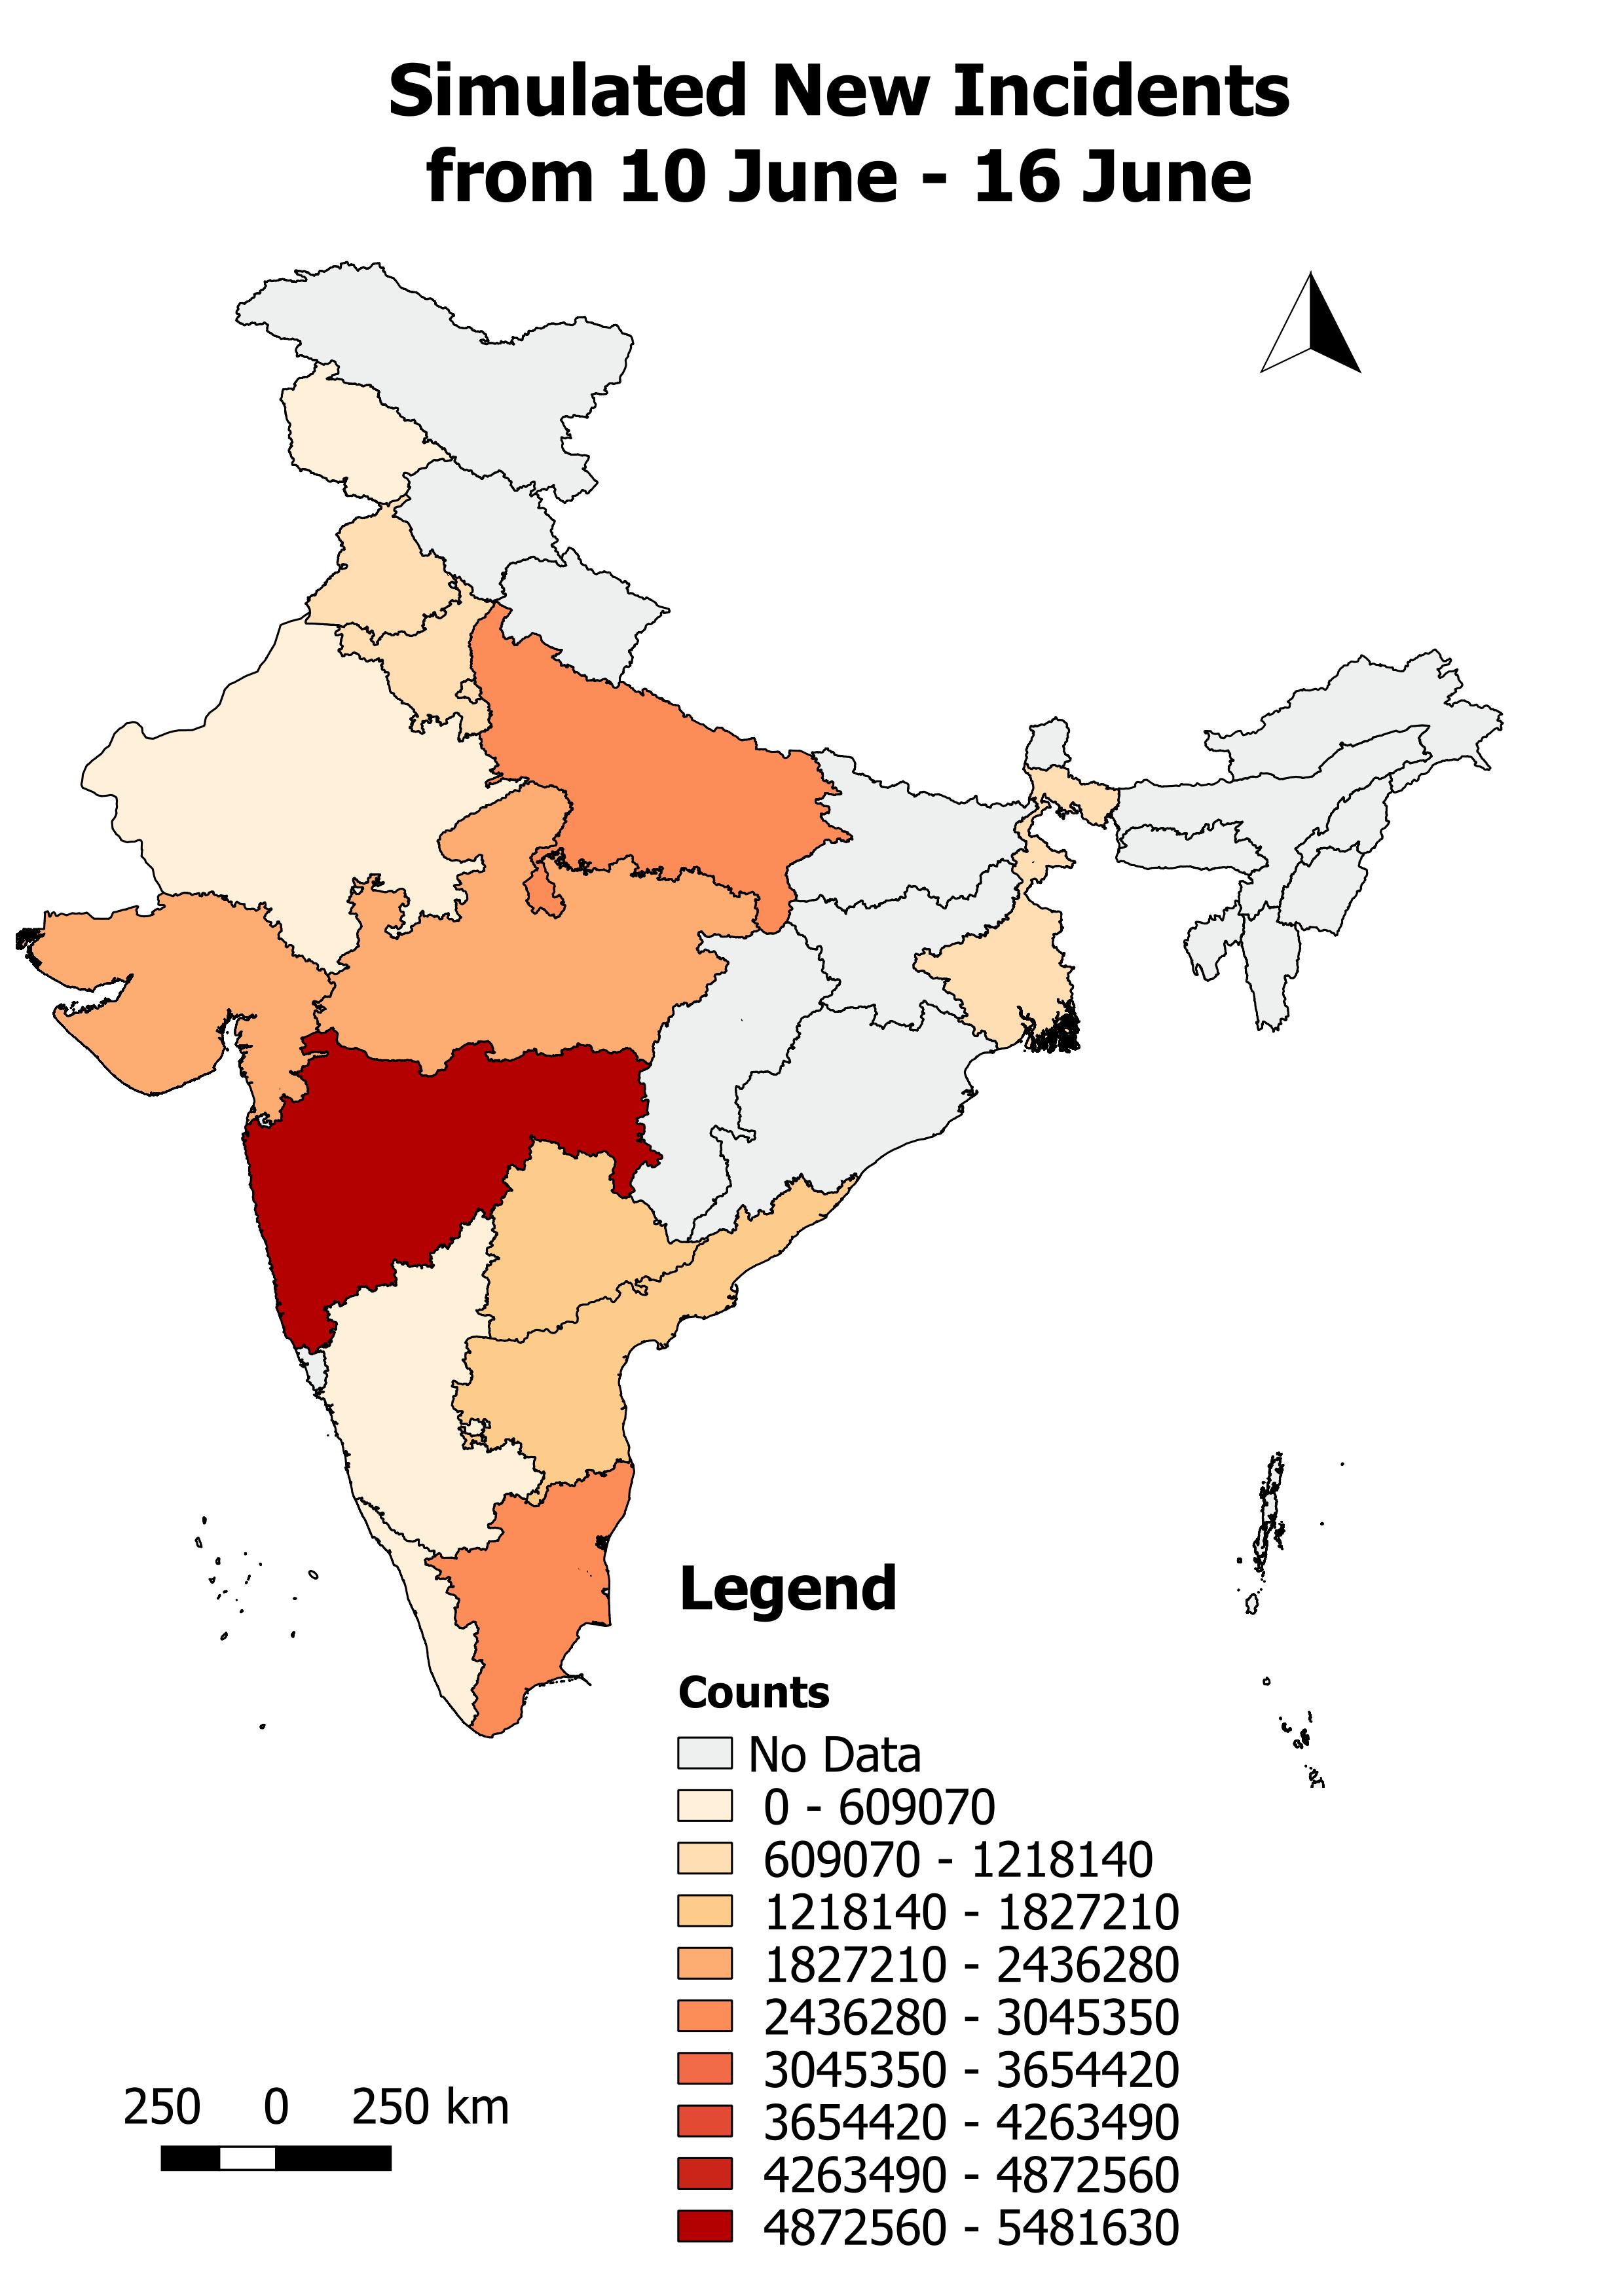 |
|
|
12th April 2020 |
| 17 June - 23 June |  |
|
|
12th April 2020 |
| 24 June- 30 June | 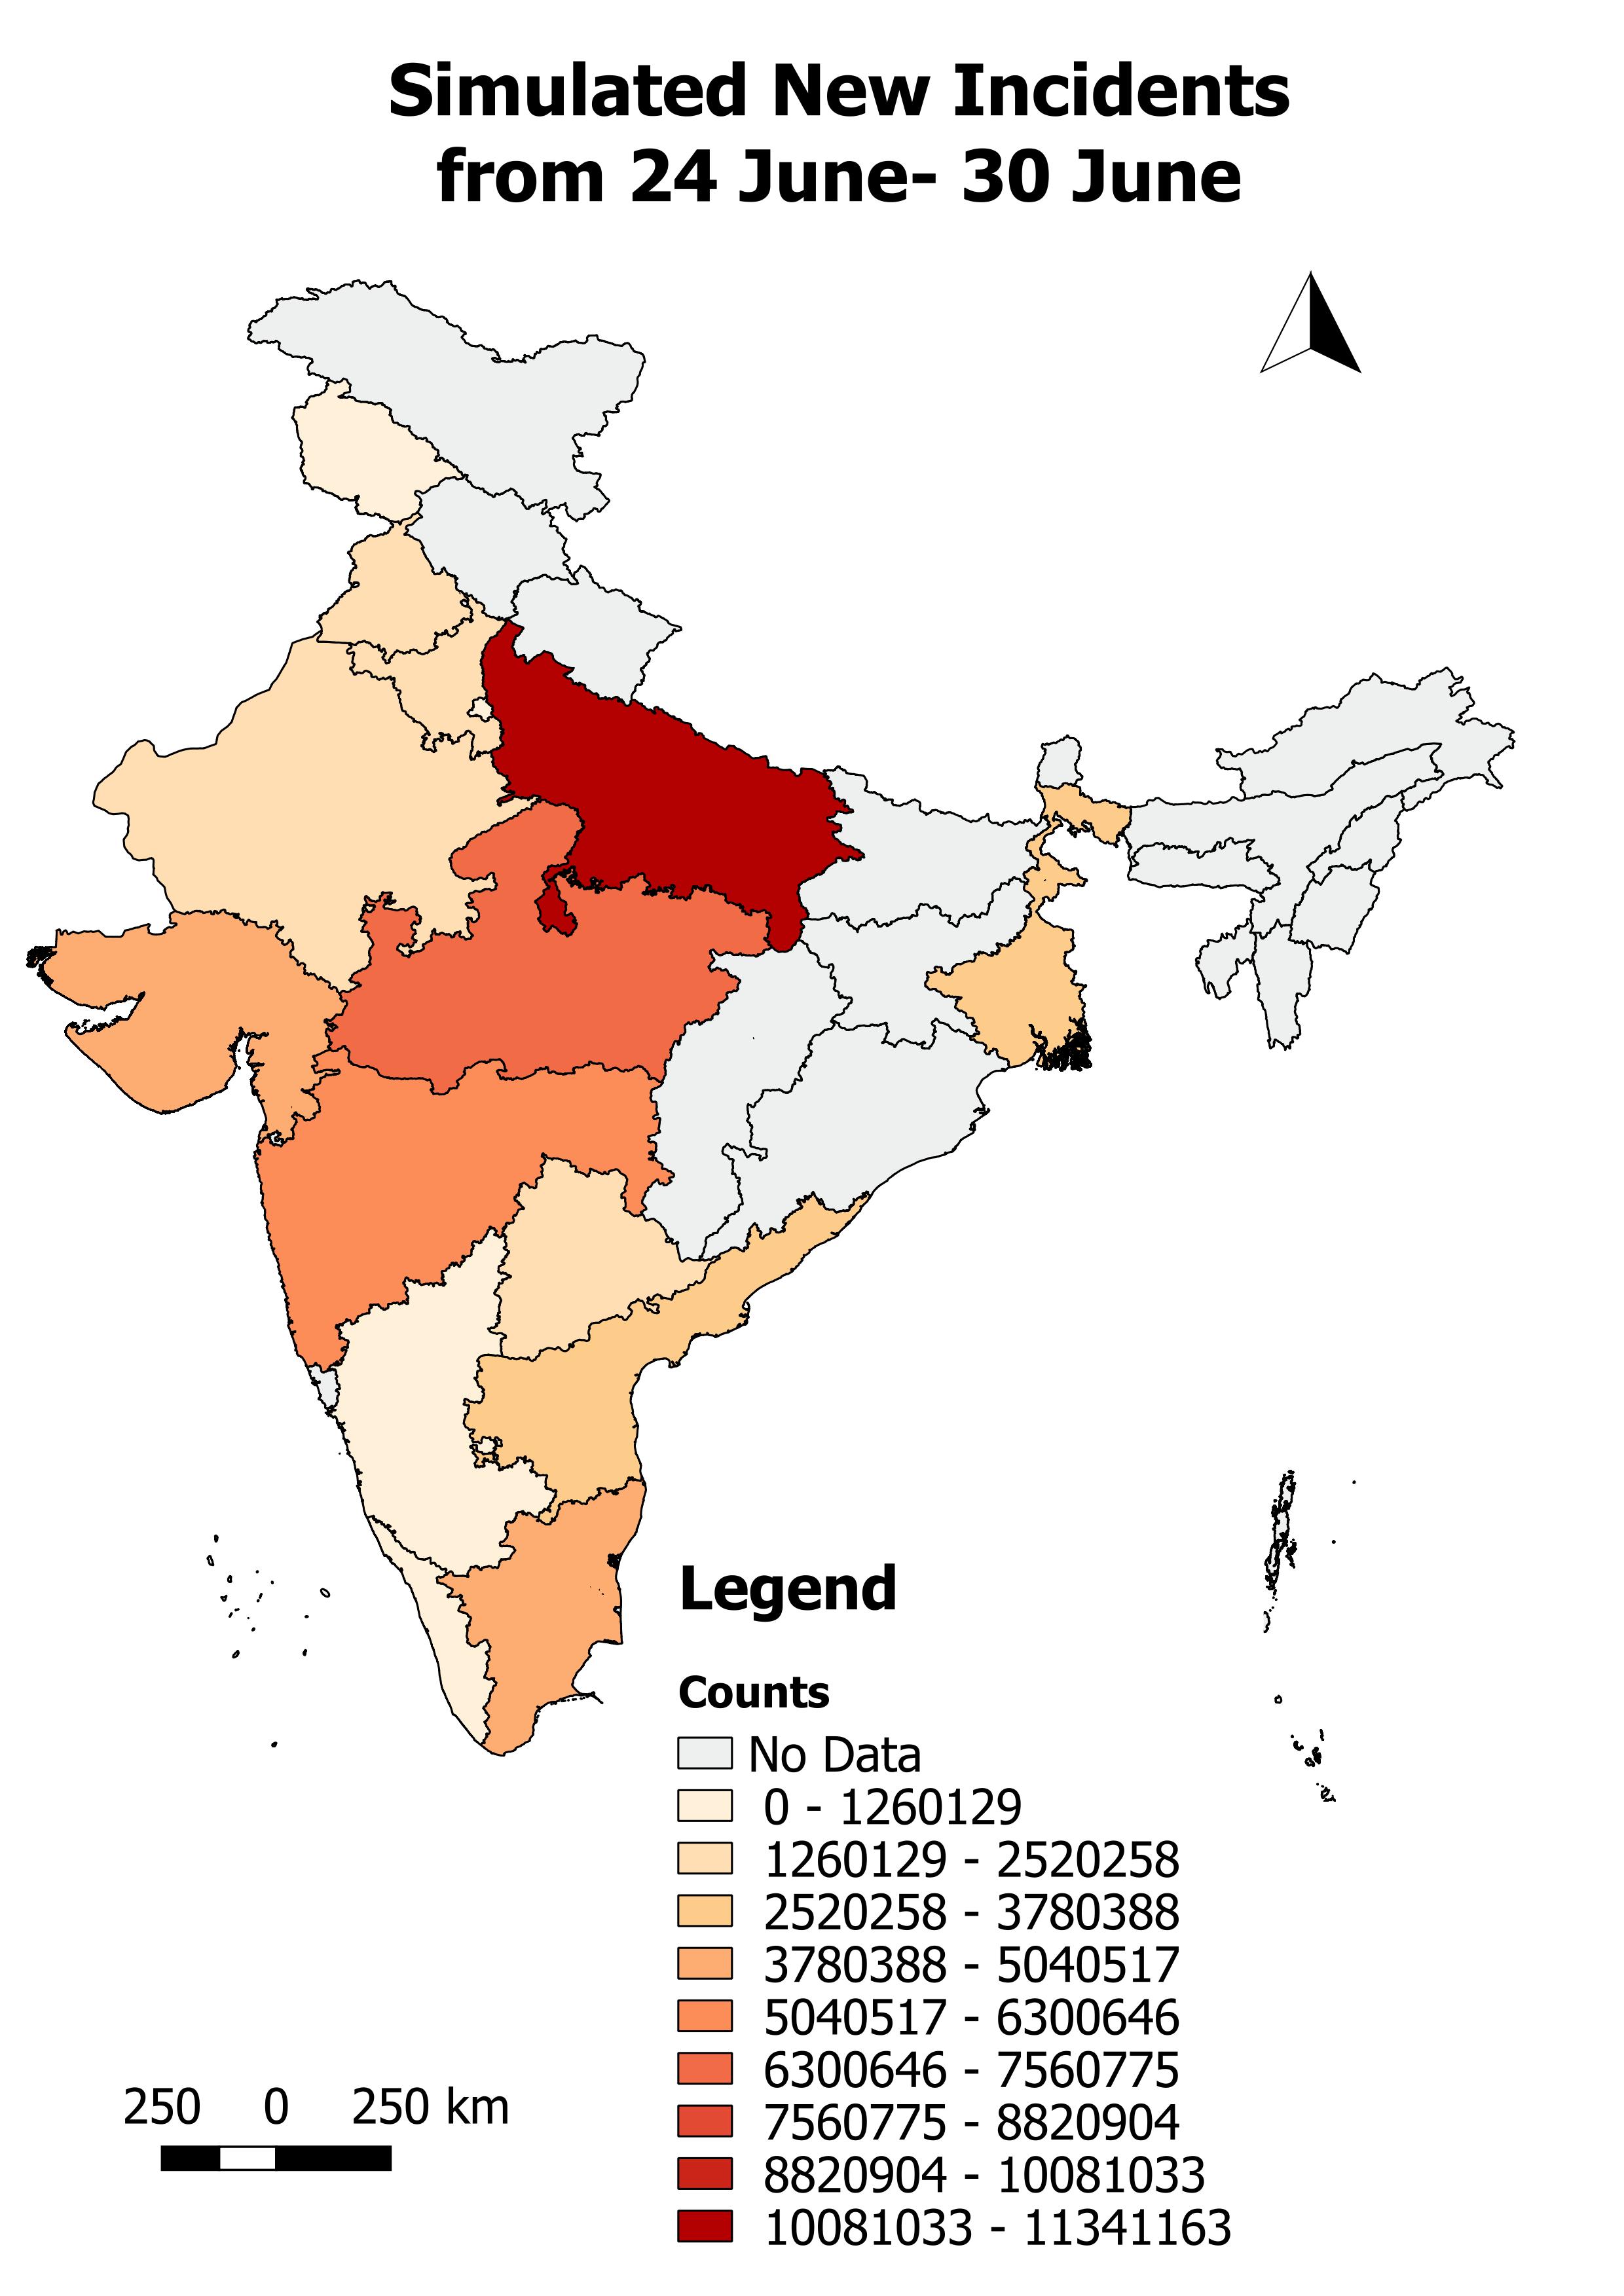 |
|
|
12th April 2020 |
| Impacts | Total increase in incidence during April to June wrt the count on April 14th | Total increase in mortality during April to June wrt the count on April 14th | Time when daily incidence will reach peak | Time when daily mortality will reach peak | Total Recovery during April to June | Last updated |
|---|---|---|---|---|---|---|
| System Dynamics Model | 204803430 | 3068928 | 30th June | 30th June | 79550695 | 12th April 2020 |
| Statistical Model | 173585624 | 1672064 | 3rd June | 30th June | NA | 12th April 2020 |
| X-SEAIPR Model |
Goto Top of the page