Data Collection
Lecture notes in Transportation Systems Engineering
August 4, 2011
The four-stage modeling, an important tool for forecasting future demand and
performance of a transportation system, was developed for evaluating
large-scale infrastructure projects.
Therefore, the four-stage modeling is less suitable for the management and
control of existing software.
Since these models are applied to large systems, they require information about
travelers of the area influenced by the system.
Here the data requirement is very high, and may take years for the data
collection, data analysis, and model development.
In addition, meticulous planning and systematic approach are needed for
accurate data collection and processing.
This chapter covers three important aspects of data collection, namely, survey
design, household data collection, and data analysis.
Finally, a brief discussion of other important surveys is also presented.
Designing the data collection survey for the transportation projects is not
easy.
It requires considerable experience, skill, and a sound understanding of the
study area.
It is also important to know the purpose of the study and details of the
modeling approaches, since data requirement is influenced by these.
Further, many practical considerations like availability of time and money also
has a strong bearing on the survey design.
In this section, we will discuss the basic information required from a data
collection, defining the study area, dividing the area into zones, and
transport network characteristics.
Typical information required from the data collection can be grouped into four
categories, enumerated as below.
- Socio-economic data:
Information regarding the socio-economic characteristics of the study area.
Important ones include income, vehicle ownership, family size, etc.
This information is essential in building trip generation and modal split
models.
- Travel surveys:
Origin-destination travel survey at households and traffic data from cordon
lines and screen lines (defined later).
Former data include the number of trips made by each member of the household,
the direction of travel, destination, the cost of the travel, etc.
The latter include the traffic flow, speed, and travel time measurements.
These data will be used primarily for the calibration of the models, especially
the trip distribution models.
- Land use inventory:
This includes data on the housing density at residential zones, establishments
at commercial and industrial zones.
This data is especially useful for trip generation models.
- Network data:
This includes data on the transport network and existing inventories.
Transport network data includes road network, traffic signals, junctions etc.
The service inventories include data on public and private transport networks.
These particulars are useful for the model calibration, especially for the
assignment models.
Once the nature of the study is identified, the study area can be defined to
encompass the area of expected policy impact.
The study area need not be confirmed by political boundaries, but bounded by
the area influenced by the transportation systems.
The boundary of the study area is defined by what is called as external
cordon or simply the cordon line.
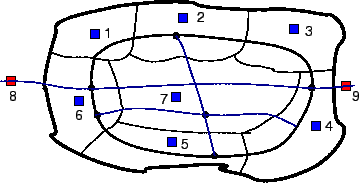
A sample of the zoning of a study area is shown in
figure 1
Figure 1:
zoning of a study area
 |
Interactions with the area outside the cordon are defined via external stations
which effectively serve as doorways to trips, into, out of, and through the
study area.
In short, study area should be defined such that majority of trips have their
origin and destination in the study area and should be bigger than the
area-of-interest covering the transportation project.
Once the study area is defined, it is then divided into a number of small units
called traffic analysis zones (TAZ) or simply zones.
The zone with in the study area are called internal zones.
Zones are modeled as if all their attributes and properties were
concentrated in a single point called the zonecentroid.
The centroids are connected to the nearest road junction or rail station by
centroid connectors.
Both centroid and centroid connectors are notional and it is assumed that all
people have same travel cost from the centroid to the nearest transport
facility which is the average for a zone.
The intersection from outside world is normally represented through
external zones.
The external zones are defined by the catchment area of the major transport
links feeding to the study area.
Although the list is not complete, few guidelines are given below for selecting
zones.
- zones should match other administrative divisions, particularly census
zones.
- zones should have homogeneous characteristics, especially in land use,
population etc.
- zone boundaries should match cordon and screen lines, but should not
match major roads.
- zones should be as smaller in size as possible so that the error in
aggregation caused by the assumption that all activities are concentrated at
the zone centroids is minimum.
Transport network consists of roads,junctions, bus stops, rails, railway
station etc.
Normally road network and rail network are represented separately.
Road network is considered as directed graph of nodes and links.
Each node and links have their own properties.
Road link is normally represented with attributes like starting node, ending
node, road length, free flow speed, capacity, number of lanes or road width,
type of road like divided or undivided etc.
Road junctions or nodes are represented with attributes like node number,
starting nodes of all links joining the current node, type of intersection
(uncontrolled, round about, signalized, etc.).
Similarly public transport network like bus transit network and rail network
are represented, but with attributes relevant to them.
These may include frequency of service, fare of travel, line capacity, station
capacity etc.
This completes the inventory of base-year transportation facility.
To understand the behavior and factors affecting the travel, one has got the
origin of travel when the decision for travel is made.
It is where people live as family which is the household.
Therefore household data is considered to be the most basic and authentic
information about the travel pattern of a city.
Ideally one should take the details of all the people in the study to get
complete travel details.
However, this is not feasible due to large requirement of time and resources
needed.
In addition this will cause difficulties in handling these large data in
modeling stage.
Therefore, same sample households are randomly selected and survey is conducted
to get the household data.
Higher sample size is required fro large population size, and vice-versa.
Normally minimum ten percent samples are required for population less than
50,000. But for a population more than one million require only one percent
for the same accuracy.
The next step in the survey is the questionnaire design.
A good design will ensure better response from the respondent and will
significantly improve the quality of data.
Design of questionnaire is more of an art than a science.
However few guiding principles can be laid out.
The questionnaire should be simple, direct, should take minimum time, and
should cause minimum burden to the respondent.
Traditional household survey has three major sections; household
characteristics, personal characteristics, and trip details.
Household characteristics
This section includes a set of questions designed to obtain socioeconomic
information about the household.
Relevant questions are:number of members in the house, no.of employed people,
number of unemployed people, age and sex of the members in the house etc.,
number of two-wheelers in the house, number of cycles, number of cars in the
house etc., house ownership and family income.
Personal characteristics
This part includes questions designed to classify the household members(older
than 5) according to the following aspects:relation to the head of the
household (e.g. wife, son), sex, age, possession of a driving license,
educational level, and activity.
Trip data
This part of the survey aims at detecting and characterizing all trips made by
the household members identified in the first part. A trip is normally defined
as any movement greater than 300 meters from an origin to a destination with a
given purpose. Trips are characterized on the basis of variables such as:
origin and destination, trip purpose, trip start and ending times, mode used,
walking distance, public-transport line and transfer station or bus stop (if
applicable).
Once the questionnaire is ready, the next step is to conduct the actual survey
with the help of enumerators.
Enumerators has to be trained first by briefing them about the details of the
survey and how to conduct the survey.
They will be given random household addresses and the questionnaire set.
They have to first get permission to be surveyed from the household.
They may select a typical working day for the survey and ask the members of the
household about the details required in the questionnaire.
They may take care that each member of the household should answer about their
own travel details, except for children below 12 years.
Trip details of children below 5 years are normally ignored.
Since the actual survey may take place any time during the day, the respondents
are required to answer the question about the travel details of the previous
day.
There are many methods of the administration of the survey and some of
them are discussed below:
- Telephonic:
The enumerator may use telephone to fix an appointment and then conduct
detailed telephonic interview.
This is very popular in western countries where phone penetration is very
high.
- Mail back:
The enumerator drops the questionnaire to the respondent and asks them to fill
the details and mail them back with required information.
Care should be taken to design the questionnaire so that it is self
explanatory.
- Face-to-face
In this method, the enumerator visits the home of the respondent and asks the
questions and fills up the questionnaire by himself.
This is not a very socially acceptable method in the developed countries, as
these are treated as intrusion to privacy.
However, in many developed countries, especially with less educated people,
this is the most effective method.
The raw data collected in the survey need to be processed before direct
application in the model.
This is necessary, because of various errors, except in the survey both in the
selection of sample houses as well as error in filling details.
In this section, we will discuss three aspects of data preparation; data
correction, data expansion, and data validation.
Various studies have identified few important errors that need to be corrected,
and are listed below.
- Household size correction
It may be possible that while choosing the random samples, one may choose
either larger or smaller than the average size of the population as observed in
the census data and correction should be made accordingly.
- Socio-demographic corrections
It is possible that there may be differences between the distribution of the
variables sex, age, etc. between the survey, and the population as observed
from the census data.
This correction is done after the household size correction.
- Non-response correction
It is possible that there may not be a response from many respondents, possible
because they are on travel everyday.
Corrections should be made to accommodate this, after the previous two
corrections.
- Non-reported trip correction
In many surveys people underestimate the non-mandatory trips and the actual
trips will be much higher than the reported ones.
Appropriate correction need to be applied for this.
The second step in the data preparation is to amplify the survey data in order
to represent the total population of the zone.
This is done with the help of expansion factor which is defined as the ratio of
the total number of household addressed in the population to that of the
surveyed.
A simple expansion factor  for the zone
  could be of the following
form.
could be of the following
form.
 |
(1) |
where  is the total number of household in the original
population list,
is the total number of household in the original
population list,  is the total number of addresses selected as the original
sample, and
is the total number of addresses selected as the original
sample, and  is the number of samples where no response was obtained.
In order to have confidence on the data collected from a sample population,
three validation tests are adopted usually.
The first simply considers the consistency of the data by a field visit
normally done after data entry stage.
The second validation is done by choosing a computational check of the
variables.
For example, if age of a person is shown some high unrealistic values like 150
years.
The last is a logical check done for the internal consistency of the data.
For example, if the age of a person is less than 18 years, then he cannot have
a driving license.
Once these corrections are done, the data is ready to be used in modeling.
In addition to the household surveys, these other surveys are needed for
complete modeling involving four stage models.
Their primary use is for the calibration and validation of the models, or act
as complementary to the household survey.
These include O-D surveys, road side interviews, and cordon and screen line
counts.
Sometime four small studies, or to get a feel of the O-D pattern without doing
elaborate survey, work space interviews are conducted to find the
origin-destination of employers in a location.
Although they are biased in terms of the destination, they are random in terms
of the mode of travel.
These provide trips not registered in a household survey, especially
external-internal trips.
This involves asking questions to a sample of drivers and passengers of
vehicles crossing a particular location.
Unlike household survey, the respondent will be asked with few questions like
origin, destination, and trip purpose.
Other information like age, sex, and income can also be added, but it should be
noted that at road-side, drivers will not be willing to spend much time for
survey.
These provide useful information about trips from and to external zones.
For large study area, internal cordon-line can be defined and surveying can be
conducted.
The objective of the survey is primarily to collect the origin and destination
zones and for this many suitable methods can be adopted.
It could be either recording the license plate number at all the external
cordon points or by post-card method.
Screen lines divide the study area into large natural zones, like either
sides of a river, with few crossing points between them.
The procedure for both cordon-line and screen-line survey are similar to
road-side interview.
However, these counts are primarily used for calibration and validation of the
models.
Data collection is one of the most important steps in modeling.
Only if accurate data is available, modeling becomes successful.
Survey design is discussed in detail.
Household data gives important information required for data collection.
Questionnaire should be simple, less time consuming and should be designed such that
the required information is obtained with less burden on the respondent.
Data collected should be prepared well before application.
Various corrections should be made in data collection before they are used
in modeling.
Finally, other types of surveys are also discussed.
- The data that is useful for developing trip generation models is
- Travel survey data
- Land-use inventory data
- Network data
- None of these
- Which of the following is not a criterion for zoning?
- zones should match other administrative divisions, particularly census
zones.
- zones should have homogeneous characteristics, especially in land use,
population etc.
- zone boundaries should match cordon and screen lines, but should not
match major roads.
- zones should have regular geometric shape.
- The data that is useful for developing trip generation models is
- Travel survey data
- Land-use inventory data

- Network data
- None of these
- Which of the following is not a criterion for zoning?
- zones should match other administrative divisions, particularly census
zones.
- zones should have homogeneous characteristics, especially in land use,
population etc.
- zone boundaries should match cordon and screen lines, but should not
match major roads.
- zones should have regular geometric shape
Prof. Tom V. Mathew
2011-08-04