Traffic data collection
Lecture notes in Transportation Systems Engineering
January 21, 2010
Unlike many other disciplines of the engineering, the situations that are
interesting to a traffic engineer cannot be reproduced in a laboratory.
Even if road and vehicles could be set up in large laboratories, it is
impossible to simulate the behavior of drivers in the laboratory.
Therefore, traffic stream characteristics need to be collected only from the
field.
There are several methods of data collection depending on the need of the
study and some important ones are described in this chapter.
The most important traffic characteristics to be collected from the field
includes sped, travel time, flow and density.
Some cases, spacing and headway are directly measured.
In addition, the occupancy, ie percentage of time a point on the road is
occupied by vehicles is also of interest.
The measurement procedures can be classified based on the geographical extent
of the survey into five categories:
(a) measurement at point on the road,
(b) measurement over a short section of the road (less than 500 metres)
(c) measurement over a length of the road (more than about 500 metres)
(d) wide area samples obtained from number of locations, and
(e) the use of an observer moving in the traffic stream.
In each category, numerous data collection are there.
However, important and basic methods will be discussed.
The most important point measurement is the vehicle volume count.
Data can be collected manually or automatically.
In manual method, the observer will stand at the point of interest and count
the vehicles with the help of hand tallies.
Normally, data will be collected for short interval of 5 minutes or 15 minutes
etc. and for each types of vehicles like cars, two wheelers, three wheelers,
LCV, HCV, multi axle trucks, nonmotorised traffic like bullock cart, hand cart
etc.
From the flow data, flow and headway can be derived.
Modern methods
include the use of inductive loop detector, video camera, and many other
technologies.
These methods helps to collect accurate information for long duration.
In video cameras, data is collected from the field and is then analyzed in the
lab for obtaining results.
Radars and microwave detectors are used to obtain the speed of a vehicle at a
point.
Since no length is involved, density cannot be obtained by measuring at a
point.
The main objective of this study is to find the spot speed of vehicles.
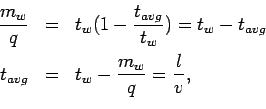
Manual methods include the use of enoscope.
In this method a base length of about 30-90 metres is marked on the road.
Enoscope is placed at one end and observer will stand at the other end.
He could see the vehicle passing the farther end through enoscope and starts
the stop watch.
Then he stops the stop watch when the vehicle passes in front of him.
The working of the enoscope is shown in figure 1.
Figure 1:
Illustration of measurement over short section using enoscope
 |
An alternative method is to use pressure contact tube which gives a
pressure signal when vehicle moves at either end.
Another most widely used method is inductive loop detector which works on the
principle of magnetic inductance.
Road will be cut and a small magnetic loop is placed.
When the metallic content in the vehicle passes over it, a signal will be
generated and the count of the vehicle can be found automatically.
The advantage of this detector is that the counts can be obtained throughout
the life time of the road.
However, chances of errors are possible because noise signals may be generated
due to heavy vehicle passing adjacent lanes.
When dual loops are used and if the spacing between them is known then speed
also can be calculated in addition to the vehicle cost.
This is normally used to obtain variations in speed over a stretch of road.
Usually the stretch will be having a length more than 500 metres.
We can also get density.
Most traditional method uses aerial photography.
From a single frame, density can be measured, but not speed or volumes.
In time lapse photography, several frames are available.
If several frames are obtained over short time intervals, speeds can be
measured from the distance covered between the two frames and time interval
between them.
Determination of any of the two parameters of the traffic flow will provide the
third one by the equation  .
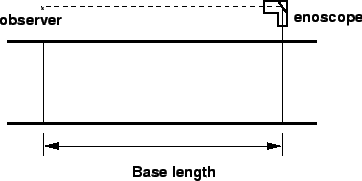
Moving observer method is the most commonly used method to get the relationship
between the fundamental stream characteristics.
In this method, the observer moves in the traffic stream unlike all other
previous methods.
.
Moving observer method is the most commonly used method to get the relationship
between the fundamental stream characteristics.
In this method, the observer moves in the traffic stream unlike all other
previous methods.
Consider a stream of vehicles moving in the north bound
direction.
Two different cases of motion can be considered.
The first case considers the traffic stream to be moving and the observer to be
stationary.
Figure 2:
Illustration of moving observer method
 |
If  is the number of vehicles overtaking the observer during a period,
 , then flow
  is
is  , or
, or
 |
(1) |
The second case assumes that the stream is stationary and the observer moves
with speed  . If
. If  is the number of vehicles overtaken by observer over
a length
is the number of vehicles overtaken by observer over
a length  , then by definition, density
  is
is  , or
, or
 |
(2) |
or
 |
(3) |
where  is the speed of the observer and is the time taken for the
observer to cover the road stretch.
Now consider the case when the observer is moving within the stream.
In that case
is the speed of the observer and is the time taken for the
observer to cover the road stretch.
Now consider the case when the observer is moving within the stream.
In that case  vehicles will overtake the observer and
  vehicles will
be overtaken by the observer in the test vehicle.
Let the difference
vehicles will
be overtaken by the observer in the test vehicle.
Let the difference  is given by
  - , then from equation
1 and equation 3,
- , then from equation
1 and equation 3,
 |
(4) |
This equation is the basic equation of moving observer method, which relates
 to the counts , and
  that can be obtained from the test.
However, we have two unknowns, and , but only one equation.
For generating another equation, the test vehicle is run twice once with the
traffic stream and another one against traffic stream, i.e.
that can be obtained from the test.
However, we have two unknowns, and , but only one equation.
For generating another equation, the test vehicle is run twice once with the
traffic stream and another one against traffic stream, i.e.
where,  denotes against and with traffic flow.
It may be noted that the sign of equation 6 is negative, because
test vehicle moving in the opposite direction can be considered as a case when
the test vehicle is moving in the stream with negative velocity.
Further, in this case, all the vehicles will be overtaking, since it is moving
with negative speed.
In other words, when the test vehicle moves in the opposite direction, the
observer simply counts the number of vehicles in the opposite direction.
Adding equation 5 and 6, we will get the first
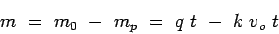
parameter of the stream, namely the flow(q) as:
denotes against and with traffic flow.
It may be noted that the sign of equation 6 is negative, because
test vehicle moving in the opposite direction can be considered as a case when
the test vehicle is moving in the stream with negative velocity.
Further, in this case, all the vehicles will be overtaking, since it is moving
with negative speed.
In other words, when the test vehicle moves in the opposite direction, the
observer simply counts the number of vehicles in the opposite direction.
Adding equation 5 and 6, we will get the first
parameter of the stream, namely the flow(q) as:
 |
(7) |
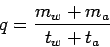
Now calculating space mean speed from equation 5,
If  is the mean stream speed, then average travel time is given by
 . Therefore,
Rewriting the above equation, we get the second parameter of the traffic flow,
namely the mean speed and can be written as,
 |
(8) |
Thus two parameters of the stream can be determined.
Knowing the two parameters the third parameter of traffic flow density ()
can be found out as
 |
(9) |
For increase accuracy and reliability, the test is performed a number of times
and the average results are to be taken.
The length of a road stretch used for conducting the moving observer test is
0.5 km and the speed with which the test vehicle moved is 20 km/hr.
Given that the number of vehicles encountered in the stream while the test
vehicle was moving against the traffic stream is 107, number of vehicles that
had overtaken the test vehicle is 10, and the number of vehicles overtaken by
the test vehicle is 74, find the flow, density and average speed of the stream.
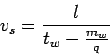
Time taken by the test vehicle to reach the other end of the stream while it is
moving along with the traffic is
 = 0.025 hr
Time taken by the observer to reach the other end of the stream while it is
moving against the traffic is
= 0.025 hr
Time taken by the observer to reach the other end of the stream while it is
moving against the traffic is  = 0.025 hr
Flow is given by equation,
q =
= 0.025 hr
Flow is given by equation,
q =
 = 860 veh/hr
Stream speed can be found out from equation
= 860 veh/hr
Stream speed can be found out from equation
 = 5 km/hr
Density can be found out from equation
as k =
= 5 km/hr
Density can be found out from equation
as k =  = 172veh/km
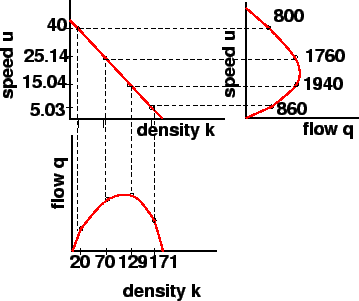
The data from four moving observer test methods are shown in the table.
Column 1 gives the sample number, column 2 gives the number of vehicles moving
against the stream, column 3 gives the number of vehicles that had overtaken
the test vehicle, and last column gives the number of vehicles overtaken by the
test vehicle.
Find the three fundamental stream parameters for each set of data.
Also plot the fundamental diagrams of traffic flow.
| Sample no. |
1 |
2 |
3 |
| 1 |
107 |
10 |
74 |
| 2 |
113 |
25 |
41 |
| 3 |
30 |
15 |
5 |
| 4 |
79 |
18 |
9 |
| Sample no. |
 |
|
|
 |
 |
 |
 |
 |
 |
| 1 |
107 |
10 |
74 |
-64 |
0.025 |
0.025 |
860 |
5.03 |
171 |
| 2 |
113 |
25 |
41 |
-16 |
0.025 |
0.025 |
1940 |
15.04 |
129 |
| 3 |
30 |
15 |
5 |
10 |
0.025 |
0.025 |
800 |
40 |
20 |
| 4 |
79 |
18 |
9 |
9 |
0.025 |
0.025 |
1760 |
25.14 |
70 |
From the calculated values of flow, density and speed, the three fundamental
diagrams can be plotted as shown in figure 3.
Figure 3:
Fundamental diagrams of traffic flow
 |
Traffic engineering studies differ from other studies in the fact that they
require extensive data from the field which cannot be exactly created in any
laboratory.
Speed data are collected from measurements at a point or over a short section
or over an area.
Traffic flow data are collected at a point.
Moving observer method is one in which both speed and traffic flow data are
obtained by a single experiment.
- In the moving observer experiment, if the density is k, speed of the observer is , length of the test stretch is , is the time taken by the observer to cover the road stretch, the number of vehicles overtaken by the observer is given by,


-


- If the length of the road stretch taken for conducting moving observer experiment is 0.4 km, time taken by the observer to move with the traffic is 5 seconds, number of vehicles moving with the test vehicle in the same direction is 10, flow is 10 veh/sec, find the mean speed.
- 50 m/s
- 100 m/s
- 150 m/s
- 200 m/s
- In the moving observer experiment, if the density is k, speed of the observer is , length of the test stretch is , is the time taken by the observer to cover the road stretch, the number of vehicles overtaken by the observer is given by,
-
-
-

- If the length of the road stretch taken for conducting moving observer experiment is 0.4 km, time taken by the observer to move with the traffic is 5 seconds, number of vehicles moving with the test vehicle in the same direction is 10, flow is 10 veh/sec, find the mean speed.
- 50 m/s
- 100 m/s
- 150 m/s
- 200 m/s
Solution:
Given that l=0.4 km, =5seconds,  =10,q=10 veh/sec, substituting in equation,
 =100m/s.
Prof. Tom V. Mathew
2010-01-21