Parking
Lecture notes in Transportation Systems Engineering
3 August 2009
Parking is one of the major problems that is created by the increasing road
traffic.
It is an impact of transport development.
The availability of less space in urban areas has increased the demand for
parking space especially in areas like Central business district.
This affects the mode choice also.
This has a great economical impact.
Before taking any measures for the betterment of conditions, data regarding
availability of parking space, extent of its usage and parking demand is
essential.
It is also required to estimate the parking fares also.
Parking surveys are intended to provide all these information.
Since the duration of parking varies with different vehicles, several
statistics are used to access the parking need.
Parking accumulation: It is defined as the number of vehicles
parked at a given instant of time.
Normally this is expressed by accumulation curve.
Accumulation curve is the graph obtained by plotting the number of bays
occupied with respect to time.
Parking volume: Parking volume is the total number of vehicles
parked at a given duration of time.
This does not account for repetition of vehicles.
The actual volume of vehicles entered in the area is recorded.
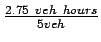
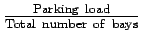
Parking load : Parking load gives the area under the
accumulation curve.
It can also be obtained by simply multiplying the number of vehicles occupying
the parking area at each time interval with the time interval.
It is expressed as vehicle hours.
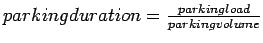
Average parking duration: It is the ratio of total vehicle hours
to the number of vehicles parked.
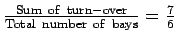
Parking turnover: It is the ratio of number of vehicles parked in
a duration to the number of parking bays available.

This can be expressed as number of vehicles per bay per time duration.
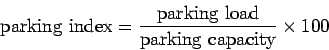
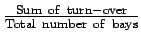
Parking index: Parking index is also called occupancy or
efficiency.
It is defined as the ratio of number of bays occupied in a time duration to the
total space available.
It gives an aggregate measure of how effectively the parking space is utilized.
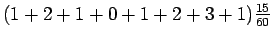
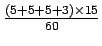
Parking index can be found out as follows
 |
(1) |
To illustrate the various measures, consider a small example in
figure 1, which shows the duration for which each of the bays are
occupied(shaded portion). Now the accumulation graph can be plotted by simply
noting the number of bays occupied at time interval of 15, 30, 45 etc. minutes
ias shown in the figure.
Figure 1:
Parking bays and accumulation curve
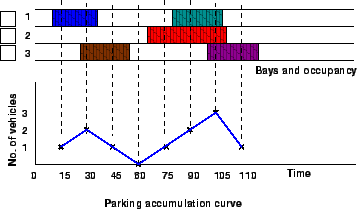 |
The various measures are calculated as shown below:
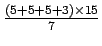
Parking volume= 5 vehicles.
Parking load =
 =
=
 = 2.75 veh hour.
Average parking duration =
 = 33 minutes.
Parking turnover =
 = 0.83 veh/hr/bay.
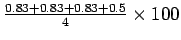
Parking index =
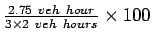 = 45.83%
Parking surveys are conducted to collect the above said parking statistics.
The most common parking surveys conducted are in-out survey, fixed period
sampling and license plate method of survey.
- In-out survey: In this survey, the occupancy count in the
selected parking lot is taken at the beginning.
Then the number of vehicles that enter the parking lot for a particular time
interval is counted.
The number of vehicles that leave the parking lot is also taken.
The final occupancy in the parking lot is also taken.
Here the labor required is very less.
Only one person may be enough.
But we wont get any data regarding the time duration for which a particular
vehicle used that parking lot.
Parking duration and turn over is not obtained.
Hence we cannot estimate the parking fare from this survey.
- Fixed period sampling: This is almost similar to in-out survey.
All vehicles are counted at the beginning of the survey.
Then after a fixed time interval that may vary between 15 minutes to i hour,
the count is again taken.
Here there are chances of missing the number of vehicles that were parked for a
short duration.
- License plate method of survey:
This results in the most accurate and realistic data.
In this case of survey, every parking stall is monitored at a continuous
interval of 15 minutes or so and the license plate number is noted down.
This will give the data regarding the duration for which a particular vehicle
was using the parking bay.
This will help in calculating the fare because fare is estimated based on the
duration for which the vehicle was parked.
If the time interval is shorter, then there are less chances of missing
short-term parkers.
But this method is very labor intensive.
Parking has some ill-effects like congestion, accidents, pollution, obstruction
to fire-fighting operations etc.
Congestion: Parking takes considerable street space leading to
the lowering of the road capacity.
Hence, speed will be reduced, journey time and delay will also subsequently
increase.
The operational cost of the vehicle increases leading to great economical loss
to the community.
Accidents: Careless maneuvering of parking and unparking leads to
accidents which are referred to as parking accidents.
Common type of parking accidents occur while driving out a car from the parking
area, careless opening of the doors of parked cars, and while bringing in the
vehicle to the parking lot for parking.
Environmental pollution: They also cause pollution to the
environment because stopping and starting of vehicles while parking and
unparking results in noise and fumes.
They also affect the aesthetic beauty of the buildings because cars parked at
every available space creates a feeling that building rises from a plinth of
cars.
Obstruction to fire fighting operations: Parked vehicles may
obstruct the movement of firefighting vehicles.
Sometimes they block access to hydrants and access to buildings.
There are some minimum parking requirements for different types of building.
For residential plot area less than 300 sq.m require only community parking
space.
For residential plot area from 500 to 1000 sq.m, minimum one-fourth of the
open area should be reserved for parking.
Offices may require atleast one space for every 70 sq.m as parking area.
One parking space is enough for 10 seats in a restaurant where as theatres and
cinema halls need to keep only 1 parking space for 20 seats.
Thus, the parking requirements are different for different land use zones.
On street parking means the vehicles are parked on the sides of the street
itself.
This will be usually controlled by government agencies itself.
Common types of on-street parking are as listed below.
This classification is based on the angle in which the vehicles are parked with
respect to the road alignment.
As per IRC the standard dimensions of a car is taken as 5 2.5 metres
and that for a truck is 3.75 7.5 metres.
2.5 metres
and that for a truck is 3.75 7.5 metres.
Parallel parking: The vehicles are parked along the length of
the road.
Here there is no backward movement involved while parking or unparking the
vehicle.
Hence, it is the most safest parking from the accident perspective.
However, it consumes the maximum curb length and therefore only a minimum
number of vehicles can be parked for a given kerb length.
This method of parking produces least obstruction to the on-going traffic on
the road since least road width is used.
Parallel parking of cars is shown in figure 2.
Figure 2:
Illustration of parallel parking
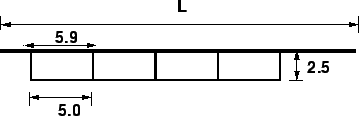 |
The length available to park  number of vehicles, L =
  30
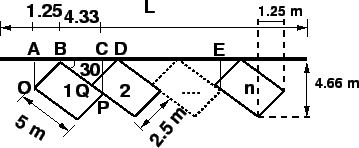
30 parking: In thirty degree parking, the vehicles are
parked at 30 with respect to the road alignment. In this case, more
vehicles can be parked compared to parallel parking.
Also there is better maneuverability.
Delay caused to the traffic is also minimum in this type of parking.
An example is shown in figure 3.
From the figure,
parking: In thirty degree parking, the vehicles are
parked at 30 with respect to the road alignment. In this case, more
vehicles can be parked compared to parallel parking.
Also there is better maneuverability.
Delay caused to the traffic is also minimum in this type of parking.
An example is shown in figure 3.
From the figure,
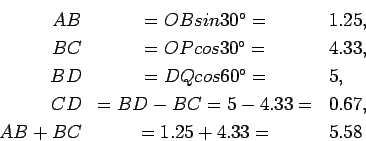
For vehicles, L = AC + (N-1)CE =5.58+(N-1)5 =0.58+5N
Figure 3:
Illustration of 30 parking
 |
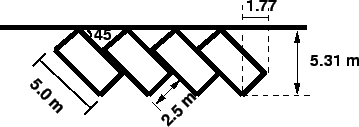
45 parking: As the angle of parking increases, more
number of vehicles can be parked.
Hence compared to parallel parking and thirty degree parking, more number of
vehicles can be accommodated in this type of parking.
From figure 4, length of parking space available for parking
number of vehicles in a given kerb is  = 3.54 N+1.77
Figure 4:
Illustration of 45 parking
 |
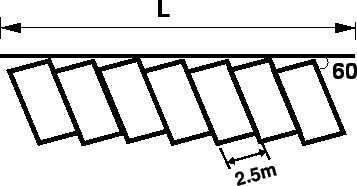
60 parking: The vehicles are parked at 60 to the
direction of road.
More number of vehicles can be accommodated in this parking type.
From the figure 5, length available for parking vehicles =2.89N+2.16.
Figure 5:
Illustration of 60 parking
 |
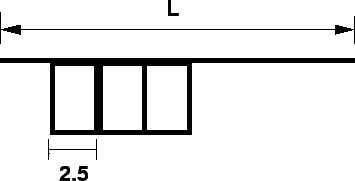
Right angle parking: In right angle parking or 90
parking, the vehicles are parked perpendicular to the direction of the road.
Although it consumes maximum width kerb length required is very little.
In this type of parking, the vehicles need complex maneuvering and this may
cause severe accidents.
This arrangement causes obstruction to the road traffic particularly if the
road width is less.
However, it can accommodate maximum number of vehicles for a given kerb length.
An example is shown in figure 6.
Length available for parking number of vehicles is = 2.5N.
Figure 6:
Illustration of 90 parking
 |
In many urban centres, some areas are exclusively allotted for parking which
will be at some distance away from the main stream of traffic.
Such a parking is referred to as off-street parking.
They may be operated by either public agencies or private firms.
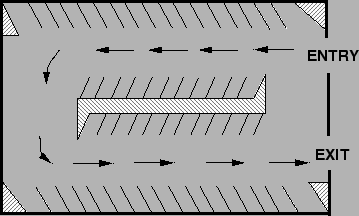
A typical layout of an off-street parking is shown in figure 7.
Figure 7:
Illustration of off-street parking
 |
From an in-out survey conducted for a parking area consisting of 40 bays, the
initial count was found to be 25. Table gives the result of the survey.
The number of vehicles coming in and out of the parking lot for a time interval
of 5 minutes is as shown in the table 1.
Find the accumulation, total parking load, average occupancy and efficiency of
the parking lot.
Table 1:
In-out survey data
| Time |
In |
Out |
| 5 |
3 |
2 |
| 10 |
2 |
4 |
| 15 |
4 |
2 |
| 20 |
5 |
4 |
| 25 |
7 |
3 |
| 30 |
8 |
2 |
| 35 |
2 |
7 |
| 40 |
4 |
2 |
| 45 |
6 |
4 |
| 50 |
4 |
1 |
| 55 |
3 |
3 |
| 60 |
2 |
5 |
The solution is shown in table 2
Table 2:
In-out parking survey solution
| Time |
In |
Out |
Accumulation |
Occupancy |
Parking load |
| (1) |
(2) |
(3) |
(4) |
(5) |
(6) |
| 5 |
3 |
2 |
26 |
65 |
130 |
| 10 |
2 |
4 |
24 |
60 |
120 |
| 15 |
4 |
2 |
26 |
65 |
130 |
| 20 |
5 |
4 |
27 |
67.5 |
135 |
| 25 |
7 |
3 |
31 |
77.5 |
155 |
| 30 |
8 |
2 |
37 |
92.5 |
185 |
| 35 |
2 |
7 |
32 |
80 |
160 |
| 40 |
4 |
2 |
34 |
85 |
170 |
| 45 |
6 |
4 |
36 |
90 |
180 |
| 50 |
4 |
1 |
39 |
97.5 |
195 |
| 55 |
3 |
3 |
39 |
97.5 |
195 |
| 60 |
2 |
5 |
36 |
90 |
180 |
| Total |
1735 |
The parking survey data collected from a parking lot by license plate method is
s shown in the table 3 below.
Find the average occupancy, average turn over, parking load, parking capacity
and efficiency of the parking lot.
Table 3:
Licence plate parking survey data
| Bay |
Time |
| |
0-15 |
15-30 |
30-45 |
45-60 |
| 1 |
1456 |
9813 |
- |
5678 |
| 2 |
1945 |
1945 |
1945 |
1945 |
| 3 |
3473 |
5463 |
5463 |
5463 |
| 4 |
3741 |
3741 |
9758 |
4825 |
| 5 |
1884 |
1884 |
- |
7594 |
| 6 |
- |
7357 |
- |
7893 |
| 7 |
- |
4895 |
4895 |
4895 |
| 8 |
8932 |
8932 |
8932 |
- |
| 9 |
7653 |
7653 |
8998 |
4821 |
| 10 |
7321 |
- |
2789 |
2789 |
| 11 |
1213 |
1213 |
3212 |
4778 |
| 12 |
5678 |
6678 |
7778 |
8888 |
See the following table for solution 4.
Table 4:
Licence plate parking survey solution
| Bay |
Time |
Time |
|
| (1) |
(2) |
(3) |
(4) |
(5) |
(6) |
(7) |
(8) |
(9) |
(10) |
| |
15 |
30 |
45 |
60 |
15 |
30 |
45 |
60 |
Turn over |
| 1 |
1456 |
9813 |
- |
5678 |
1 |
1 |
0 |
1 |
3 |
| 2 |
1945 |
1945 |
1945 |
1945 |
1 |
1 |
1 |
1 |
1 |
| 3 |
3473 |
5463 |
5463 |
5463 |
1 |
1 |
1 |
1 |
2 |
| 4 |
3741 |
3741 |
9758 |
4825 |
1 |
1 |
1 |
1 |
3 |
| 5 |
1884 |
1884 |
- |
7594 |
1 |
1 |
0 |
1 |
2 |
| 6 |
- |
7357 |
- |
7893 |
0 |
1 |
0 |
1 |
2 |
| 7 |
- |
4895 |
4895 |
4895 |
0 |
1 |
1 |
1 |
1 |
| 8 |
8932 |
8932 |
8932 |
- |
1 |
1 |
1 |
0 |
1 |
| 9 |
7653 |
7653 |
8998 |
4821 |
1 |
1 |
1 |
1 |
3 |
| 10 |
7321 |
- |
2789 |
2789 |
1 |
0 |
1 |
1 |
2 |
| 11 |
1213 |
1213 |
3212 |
4778 |
1 |
1 |
1 |
1 |
3 |
| 12 |
5678 |
6678 |
7778 |
8888 |
1 |
1 |
1 |
1 |
4 |
| |
Accumulation |
|
|
|
10 |
11 |
9 |
11 |
|
| |
Occupancy |
|
|
|
0.83 |
0.92 |
0.75 |
0.92 |
2.25 |
Columns 1 to 5 is the input data.
The parking status in every bay is coded first.
If a vehicle occupies that bay for that time interval, then it has a code 1.
This is shown in columns 6, 7, 8 and 9 of the table corresponding to the time
intervals 15, 30, 45 and 60 seconds.
- Turn over is computed as the number of vehicles present in that bay for
that particular hour.
For the first bay, it is counted as 3.
Similarly, for the second bay, one vehicle is present throughout that hour and
hence turnout is 1 itself.
This is being tabulated in column 10 of the table.
Average turn over =
 = 2.25
- Accumulation for a time interval is the total of number of vehicles in
the bays 1 to 12 for that time interval.
Accumulation for first time interval of 15 minutes = 1+1+1+1+1+0+0+1+1+1+1+1 =
10
- Parking volume = Sum of the turn over in all the bays = 27 vehicles
- Average duration is the average time for which the parking lot was used
by the vehicles.
It can be calculated as sum of the accumulation for each time interval
time interval divided by the parking volume =
 = 22.78 minutes/vehicle.
- Occupancy for that time interval is accumulation in that particular
interval divided by total number of bays.
For first time interval of 15 minutes, occupancy = (10100)/12 = 83%
Average occupancy is found out as the average of total number of vehicles
occupying the bay for each time interval. It is expressed in percentage.
Average occupancy =
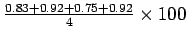 = 85.42%.
- Parking capacity = number of bays number of hours = 12 1
= 12 vehicle hours
- Parking load = total number of vehicles accumulated at the end of each
time interval time =
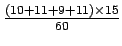 = 10.25
vehicle hours
= 10.25
vehicle hours
- Efficiency =
 =
=
 = 85.42%.
Providing suitable parking spaces is a challenge for traffic engineers and
planners in the scenario of ever increasing vehicle population.
It is essential to conduct traffic surveys in order to design the facilities or
plan the fares.
Different types of parking layout, surveys and statistics were discussed in
this chapter.
- The parking survey data collected from a parking lot by license plate
method is shown in table 5 below. Find the average occupancy, average turnover,
parking load, parking capacity and efficiency of parking lot.
Table 5:
Licence plate: problem
| Bay |
Time |
| |
0-15 |
15-30 |
30-45 |
45-60 |
| 1 |
1501 |
1501 |
4021 |
- |
| 2 |
1255 |
1255 |
1255 |
1255 |
| 3 |
3215 |
3215 |
3215 |
3215 |
| 4 |
- |
- |
3100 |
3100 |
| 5 |
1623 |
1623 |
1623 |
- |
| 6 |
2204 |
2204 |
- |
- |
Refer table 6.
Table 6:
License Plate Problem: Solution
| Bay |
Time |
Time |
|
| (1) |
(2) |
(3) |
(4) |
(5) |
(6) |
(7) |
(8) |
(9) |
(10) |
| |
15 |
30 |
45 |
60 |
15 |
30 |
45 |
60 |
Turn over |
| 1 |
1501 |
1501 |
4021 |
- |
1 |
1 |
1 |
0 |
2 |
| 2 |
1255 |
1255 |
1255 |
1255 |
1 |
1 |
1 |
1 |
1 |
| 3 |
3215 |
3215 |
3215 |
3215 |
1 |
1 |
1 |
1 |
1 |
| 4 |
- |
- |
3100 |
3100 |
0 |
0 |
1 |
1 |
1 |
| 5 |
1623 |
1623 |
1623 |
- |
1 |
1 |
1 |
0 |
1 |
| 6 |
2204 |
2204 |
- |
- |
1 |
1 |
0 |
0 |
1 |
| |
Accumulation |
|
|
|
5 |
5 |
5 |
3 |
|
| |
Occupancy |
|
|
|
0.83 |
0.83 |
0.83 |
0.5 |
|
Column 1 to 5 is the input data.
The parking status in every bay is coded first.
If a vehicle occupies that bay for that time interval, then it has a code 1.
This is shown in columns 6, 7, 8 and 9 of the tables corresponding to the time
intervals 15,30,45 and 60 seconds.
- Turn over is computed as the number of vehicles present in that bay for
that particular hour.
For the first bay, it is counted as 2.
Similarly, for the second bay, one vehicle is present throughout that hour and
hence turnout is 1 itself
This is being tabulated in column 10 of the table.
Total turn over in all the bays or parking volume= 2+1+1+1+1+1 = 7 vehicles
Average turn over =
 =1.17
=1.17
- Average duration is the average time for which the parking lot was used
by the vehicles.
It can be calculated as sum of the accumulation for each time interval
time interval divided by the parking volume =
 =
38.57 minutes/vehicle.
=
38.57 minutes/vehicle.
- Average occupancy is found out as the average of total number of vehicles
occupying the bay for each time interval. It is expressed in percentage.
Average occupancy =
 = 75%.
- Parking capacity = number of bays number of hours = 6 1
= 6 vehicle hours
- Parking load = total number of vehicles accumulated at the end of each
time interval time =
 = 4.5 vehicle
hours
= 4.5 vehicle
hours
- Efficiency =
=
 = 75%.
Prof. Tom V. Mathew
2009-08-03