| Date | November 22, 2012 |
| Time | 09.30 - 12.30 hours |
| Marks | 100 |
Attempt all questions. Make suitable assumptions, if required, and all the assumptions should be stated clearly. Intermediate steps and appropriate sketches are mandatory. Write page numbers against the questions attempted
(a) The probability of not using car=1-0.004=0.996
(b) The probability of using metro given that the person stopped using car==
![]() =0.999
=0.999
[1212] In a traffic stream, 30% of the vehicles travel at a constant speed of 60km/h, 30% at a constant speed of 80km/h, and the remaining vehicles at a constant speed of 100km/h. An observer travelling at a constant speed of 70km/h with the stream over a length of 5km is overtaken by 17 vehicles more than what he has overtaken. The observer met 303 vehicles while traveling against the stream at the same speed and over the same length of highway. What is the mean speed and flow of the traffic stream? (8)
(a)
![]() veh per hour
(b) mean speed =
veh per hour
(b) mean speed =
![]() kmph or
mean speed=100/(30/60)+(30/80)+(40/100)=78.43 kmph
kmph or
mean speed=100/(30/60)+(30/80)+(40/100)=78.43 kmph
[1217] A study area has four zones and it is observed that they generate 70, 89, 120, 110 trips per day. The average income is respectively 1500, 2500, 3500, and 2800 and the population is 3100, 2600, 3600, and 4100. Government proposes two major policy changes in zone 2. First proposal will result in an increase of income by 40 % and the second will increase the population by 50 %. Which proposal will generate more trips?. (10)
| Zone | y trips/day | Income |
Population |
|
|
|
|
| 1 | 70 | 1500 | 3100 | 105 | 217 | 225 | 961 |
| 2 | 89 | 2500 | 2600 | 222.5 | 231.4 | 625 | 676 |
| 3 | 120 | 3500 | 3600 | 420 | 432 | 1225 | 1296 |
| 4 | 110 | 2800 | 4100 | 308 | 451 | 784 | 1681 |
| 389 | 10300 | 13400 | 1055.5 | 1331.4 | 2859 | 4614 | |
| Mean | 97.25 | 2575 | 3350 |
![]() = 0.026
= 0.026
![]() =30.213
=30.213
![]() Similarly relation between
Similarly relation between ![]() and
and ![]() is
is
![]()
With increase of 40 % income, Trips/day = 0.026 (1.4 X 2400)+30.213= 118
With 50 % inciarease in population, Trips/day = 0.0226 (1.5 X 2500)+ 21.54= 106
More number of trips are produced in the first case i.e. for increase of 40 % income
[1213] The entry and exit width of a rotary intersection are 9m and 11m respectively. The width of approaches at the intersection is 15m. The traffic from the four approaches traversing the intersection is given below. If the traffic composition is 50% car, 40% two-wheelers and 10% trucks and the passenger car units of two-wheelers and trucks are 0.5 and 3 respectively, find the capacity of the rotary using TRL formulae.
| Approach | Left turn | Straight | Right turn |
| North | 500 | 800 | 300 |
| South | 400 | 350 | 450 |
| East | 250 | 400 | 500 |
| West | 300 | 450 | 500 |
| Weaving Section | 1(W-N) | 2(N-E) | 3(E-S) | 4(S-W) |
| Entry Width, e1 | 9 | 9 | 9 | 9 |
| Exit Width, e2 | 11 | 11 | 11 | 11 |
| Weaving width (e1+e2)/2+3.5 | 13.5 | 13.5 | 13.5 | 13.5 |
| Weaving Length, l= 4*w | 54 | 54 | 54 | 54 |
| Average entry/exit width (e1+e2)/2 | 10 | 10 | 10 | 10 |
| Non-weaving volume - a | 300 | 500 | 250 | 400 |
| Weaving volume - b | 950 | 1100 | 900 | 800 |
| Weaving volume - c | 850 | 900 | 1300 | 700 |
| Non-weaving volume - d | 450 | 500 | 300 | 500 |
| Total volume (a+b+c+d) | 2550 | 3000 | 2750 | 2400 |
| Weaving proportion p =(b+c)/(a+b+c+d) | 0.706 | 0.667 | 0.800 | 0.625 |
| Capacity of weaving section, Q=280w() | 4,025 | 4,094 | 3,860 | 4,167 |
| Capacity of rotary [Min.( Q1, Q2, Q3, Q4)] | 3,860 | |||
[1215]
A line of vehicles are in car following mode and all vehicles are travelling at 18 m/s with distance headway of 20 m. After 1.2 seconds,
the lead vehicle suddenly decelerates at a rate of 1.2 ![]() until it stops completely.
simulate the behaviour of first following vehicle using the GM fifth car following model for the first 2.5 seconds. Tabulate the results.
Assume headway exponent 1.2, speed exponent 1.6, sensitivity coefficient 0.8, reaction time 0.6 seconds, and scan interval 0.3 seconds.
(10)
until it stops completely.
simulate the behaviour of first following vehicle using the GM fifth car following model for the first 2.5 seconds. Tabulate the results.
Assume headway exponent 1.2, speed exponent 1.6, sensitivity coefficient 0.8, reaction time 0.6 seconds, and scan interval 0.3 seconds.
(10)
| t | a(t) | v(t) | x(t) | a(t) | v(t) | x(t) | dv | dx |
| 0 | 0 | 18.0 | 20.00 | 0.00 | 18.00 | 0.00 | 0.00 | 20.00 |
| 0.3 | 0 | 18.0 | 25.40 | 0.00 | 18.00 | 5.40 | 0.00 | 20.00 |
| 0.6 | 0 | 18.0 | 30.80 | 0.00 | 18.00 | 10.80 | 0.00 | 20.00 |
| 0.9 | 0 | 18.0 | 36.20 | 0.00 | 18.00 | 16.20 | 0.00 | 20.00 |
| 1.2 | -1.2 | 18.0 | 41.60 | 0.00 | 18.00 | 21.60 | 0.00 | 20.00 |
| 1.5 | -1.2 | 17.6 | 46.90 | 0.00 | 18.00 | 27.00 | -0.36 | 19.95 |
| 1.8 | -1.2 | 17.3 | 52.20 | 0.00 | 18.00 | 32.40 | -0.72 | 19.78 |
| 2.1 | -1.2 | 16.9 | 57.30 | -0.81 | 18.00 | 37.80 | -1.08 | 19.51 |
| 2.4 | -1.2 | 16.6 | 62.30 | -1.60 | 17.76 | 43.16 | -1.20 | 19.17 |
| 2.7 | -1.2 | 16.2 | 67.30 | -2.33 | 17.28 | 48.42 | -1.08 | 18.83 |
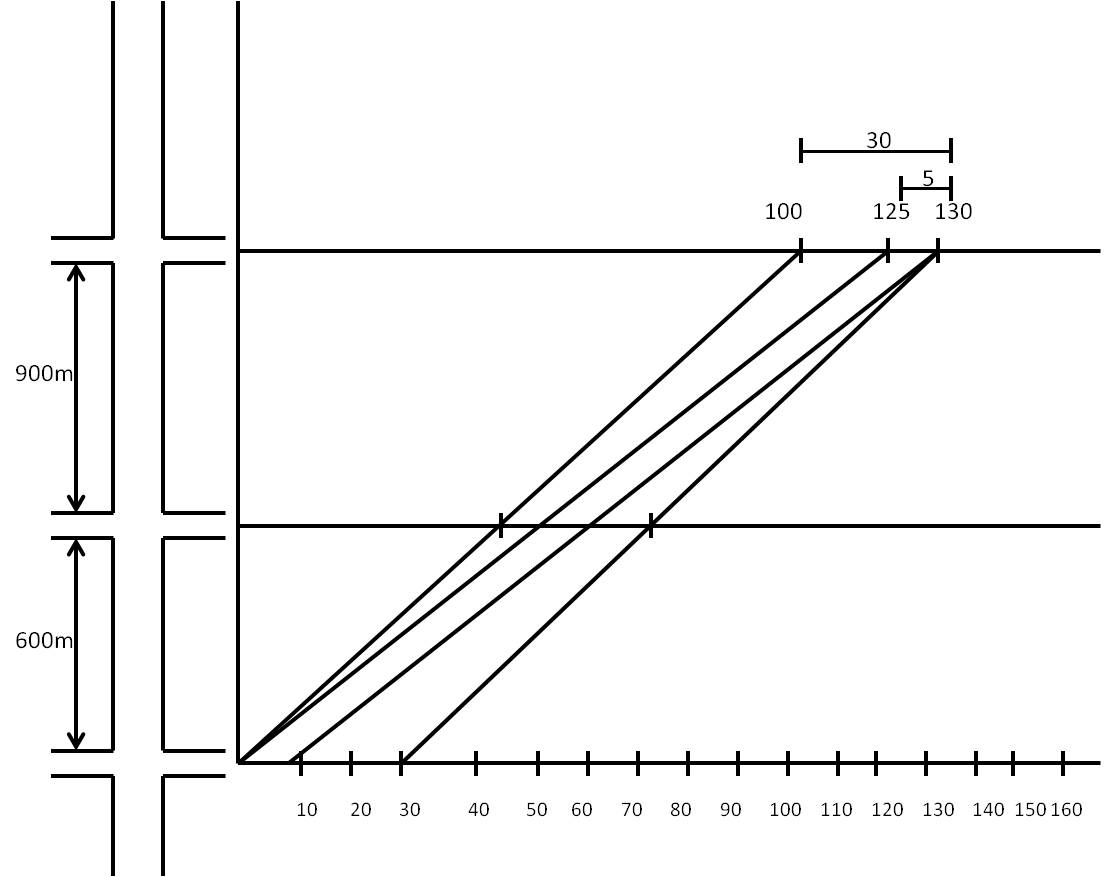
[1216] A North-South corridor has three junctions namely A, B, and C. Junction A is on the south end of the corridor and junction C is on the north end. These junctions are coordinated in the north direction. All the junctions are having two phase signals with a cycle of 80 sec. The juctions A, B, and C have green times of 40, 50, and 30 sec respectively in the coordinated direction. The distance between A and B is 600 meters and B and C is 900 meters. The junctions are coordinated considering a speed of 15 m/sec. (a) What will be the resulting band width? (b) While the corridor is operating under the above control conditions, if the vechiles could travel only at a speed of 12 m/sec, what bandwidth will be achieved? (10)
[1211] In a traffic study, the observed densities were 150, 120, 50, 70 and 20 veh/km and the corresponding speeds were 10, 25, 45, 40 and 32km/h. Find the jam density according to Greenberg's logarithmic traffic stream model. (Hint: Linearize the expression)
| x=(ln k) | y=(u) | x-xmean | y-ymean | (x-xmean)(y-ymean) |
|
| 5.011 | 10 | 0.820 | -20 | -16.723 | 0.672 |
| 4.787 | 25 | 0.597 | -5.4 | -3.222 | 0.356 |
| 3.912 | 45 | -0.279 | 14.6 | -4.071 | 0.078 |
| 4.248 | 40 | 0.058 | 9.6 | 0.553 | 0.003 |
| 2.996 | 32 | -1.195 | 1.6 | -1.912 | 1.428 |
| 4.191 | 34 | -25.375 | 2.537 |
[1219] Illustrate with neat sketches: (i) A diamond interchange showing the movement of all the flows. (ii) Road markings on a two lane bi-directional horizontal curve when the sight distance is less than the length of the curve. (iii) The concept of flow prediction in a transportation system when the supply is improved. (15)
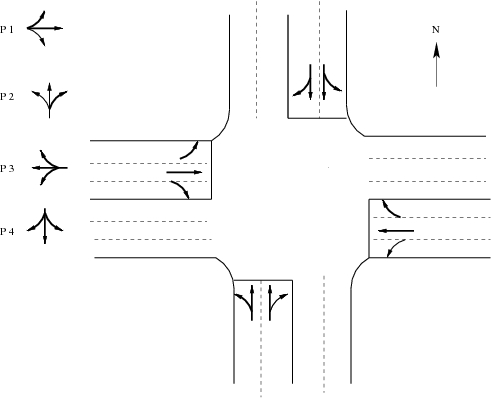
[1214] The traffic flow and phase plan for a four-legged intersection is as shown in Figure. The E-W flow is 800, W-E flow is 740, N-S flow is 450, and S-N flow is 490 vehicles per hour. Assume for all the phases the yellow time is 3 seconds, the lost time is 2 seconds, saturation headway is 1.8 seconds, and degree of saturation is 0.9. Assume left turn adjustment factor 1.10 and right turn adjustment factor 1.30. Assume the left turn and right turn traffic proportion is 10% and 20% respectively. Assuming no pedestrian traffic, compute the cycle time and green time for each phase. Compute also the stopped delay for the traffic from north.
| (1) | |||
| (2) | |||
| (3) |
| Direction wise flows | LT | TH | RT | LT+TH | RT+TH |
| N-S | 207.00 | 274.50 | |||
| W-E | 81.4 | 518.00 | 148.00 | ||
| S-N | 225.40 | 298.90 | |||
| E-W | 88 | 560.00 | 208.00 | ||
| Phases | 1 | 2 | 3 | 4 | |
| critical flows Vci | 518.00 | 298.90 | 560.00 | 274.50 |
| Effective green gi | 27.89 | 16.09 | 30.15 | 14.78 |
| Actual green Gi | 26.89 | 15.09 | 29.15 | 13.78 |
| Rounded green | 27.00 | 16.00 | 30.00 | 14.00 |
| Final cycle C | 99.00 | |||
| Effective green | 28.00 | 17.00 | 31.00 | 15.00 |
| Approach | (1)WE | (2)SN | (3)EW | (4)NS |
| Delay | 41.31 | |||