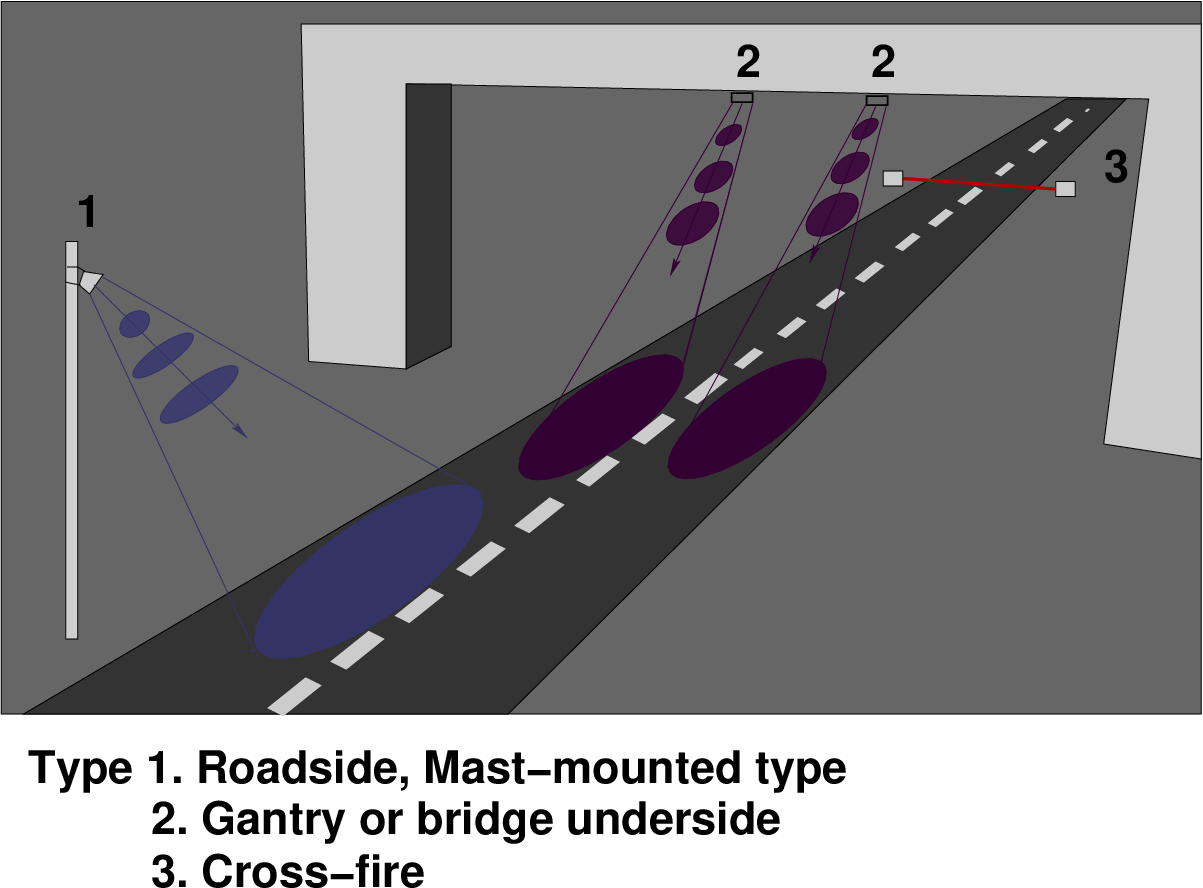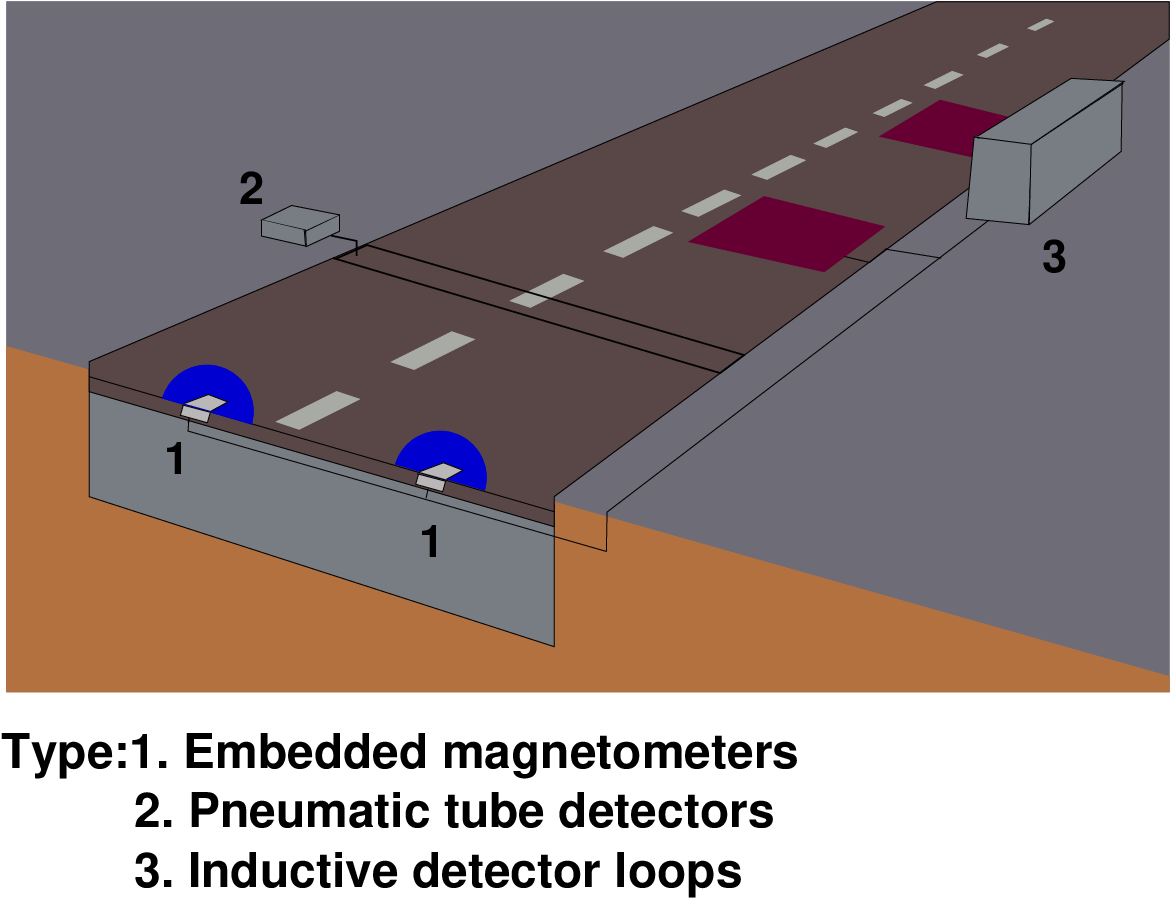
Figure 1: Typical intrusive detector configurations, Source: IMAGINE- Collection
Methods for Additional Data
This present paper offers a review on some of the latest automated traffic data collection technologies. This automated technology briefly summarizes as two methods. The first technology is in-situ technology and second one is in vehicle technology. Broadly speaking, “in-situ” technologies refer to traffic data measured by the means of detectors located along the roadside. Generally, traffic count technologies can be split into two categories: the intrusive and non-intrusive methods. The intrusive methods basically consist of a data recorder and a sensor placing on or in the road. Non-intrusive techniques are based on remote observations. Then the next order automated traffic data technology is floating car data (FCD). FCD is an alternative or rather complement source of high quality data to existing technologies. They will help improve safety, efficiency and reliability of the transportation system. They are becoming crucial in the development of new Intelligent Transportation Systems (ITS). Then finally discussed travel time prediction by these technologies.
The vehicular traffic is increasing tremendously in today’s/this world, simultaneously congestion also increases. In order to prevent congestion, one option is to increase the capacity by increasing the number of existing transportation system. A second option is to develop alternatives that increase capacity by improving the efficiency of the existing transportation system. The later focuses on building fewer lane-miles, while investing in Intelligent Transportation Systems (ITS) infrastructure. The goals of ITS include the following:
Intelligence requires information, and information requires data, which is generated by surveillance. ITS include sensor, communication, and traffic control technologies. These technologies assist states, cities, and towns nationwide, meeting the increasing demands on surface transportation system. Vehicle detection and surveillance technologies are an integral part of ITS, since they gather all or part of the data that is used in ITS. So a wide range of data is required for ITS to manage:
Traffic volume studies are conducted to determine the number, movements, and classifications of roadway vehicles at a given location. These data helps to identify critical flow time periods, determining the influence of large vehicles or pedestrians on vehicular traffic flow. The length of sampling period depends on the type of count being taken and the intended use of recorded data. Two methods are available for conducting traffic volume counts: (1) manual and (2) automatic. Manual counts are typically used to gather data for determination of vehicle classification, turning movements, direction of travel, and vehicle occupancy.
Most applications of manual counts require small samples of data at any given location. Manual counts are rarely used when the effort and expense of automated equipment are not justified. Manual counts are necessary when automated equipment is not available. Manual counts are typically used for period of less than a day. Normal intervals for a manual count are 5, 10, or 15 minutes. Traffic counts during a rush hour of Monday morning and Friday evening rush hours shows exceptionally high volumes and is not normally used in analysis; therefore, counts are usually conducted on Tuesday, Wednesday, or Thursday.
The automatic count method provides a means for gathering large amounts of traffic data. Automatic counts are usually taken in 1-hour interval for each 24-hour period. The counts extend for a week, month, or year. When the counts are recorded for each 24-hour time period, the peak flow period can be identified. Automatic counts are recorded using one of three methods: portable counters, permanent counters, and videotape.
Traffic volumes vary over time on all roads. Traffic volumes also vary dramatically from one road to another. These variations in traffic volume are even more apparent when volumes for specific vehicle types (classification) are analyzed. Consequently, the vehicle classification data collection program must gather sufficient data on traffic patterns of important vehicle types to accurately quantify the truck traffic stream to meet the needs of users. These include; time of day, day of week, time of year, direction. Vehicle classification counts are used in establishing structural and geometric design criteria, computing expected highway user revenue, and computing capacity. If a high percentage of heavy trucks exist or if the vehicle mix at the crash site is suspected as contributing to the crash problem, then classification counts should be conducted. Typically cars, station wagons, pickup and panel trucks, and motorcycles are classified as passenger cars. The observer records the classification of vehicles and its direction of travel at the intersection.
The vehicle classification counts required should not be considered separate from the volume counts traditionally performed. Instead, they should be integrated with the traditional volume counts. Because classification counts provide both classification and total volume information, they can replace traditional volume counts reducing duplication and error. Traffic surveillance equipment is used as part of advanced traffic management systems (ATMS) or advanced traveler information systems (ATIS) can be used to supply both total volume and vehicle classification information. Intelligent transportation system (ITS) technology and its resulting data are often present at high profile locations as part of safety enhancement systems. These systems can supply useful, continuous traffic monitoring data. Coordinating these traffic monitoring activities can lead to significant improvements in the amount of data available to users, while at the same time reducing the cost of data collection.
Vehicle classification data are of considerable use to agencies involved in almost all aspects of transportation planning and engineering. The need for information on truck volumes and freight movements is growing with the recognition of role that freight mobility plays in the economy, and as highway engineers realize the importance of truck volume and operating characteristics on the geometric and structural design of roadways and bridges.
Vehicle occupancy measurement is an important part of transportation congestion management and it is used for evaluating the efficiency of road system, High Occupancy Vehicle (HOV) lanes or particular congestion reduction programs. The measure occupancy is a function of speed and length of individual vehicle and thus, it could consider the effects of varying vehicle length and speed. Hence, it can be considered as a logical substitute of density. In other words, occupancy, based on practical consideration, is defined as the percentage of time the detection zone is occupied by the vehicles. Therefore, occupancy measured using detectors depends on the length of detection zone, each detector type has a differing zone of influence (detector length) and the zone of influence is effectively added to vehicle length. Hence, the measured occupancy may be different for different detection zones even for the same site having identical traffic, depending on the size and nature of the detectors. Development of intelligent systems that extract traffic density and vehicle classification information from traffic surveillance systems is crucial in traffic management. It is important to know the traffic density of the roads real time especially in HOV lanes for effective traffic management. Time estimation of reaching from one location to another and recommendation of different route alternatives using real time traffic density information are very valuable for metropolitan city residents.
Travel time can be defined as the period of time to transverse a route between any two points of interest. It is a fundamental measure in transportation. Travel time is also one of the most readily understood and communicated measure indices used by a wide variety of users, including transportation engineers, planners, and consumers. Travel time data is useful for a wide range of transportation analyses including congestion management, transportation planning, and traveler information. Congestion management systems commonly use travel time-based performance measures to evaluate and monitor traffic congestion. In addition, some metropolitan areas provide real-time travel time prediction as part of their advanced traveler information systems (ATIS). Travel time data can be obtained through a number of methods. Some of the methods involve direct measures of travel times along with test vehicles, license plate matching technique, and ITS probe vehicles. Additionally, various sensors (e.g. inductance loop detectors, acoustic sensors) in ITS deployment collect a large amount of traffic data every day, especially in metropolitan areas. Such data can be used for travel time estimation for extensive applications when direct measurements of travel times are not available.
The delay defines as “The additional travel time experienced by a driver, passenger, or pedestrian”. Delay is thus the difference between an “ideal” travel time and “actual” travel time. Since the definition of delay depends on a hypothetical “ideal travel time”, delay is not always directly measurable in the field. If the ideal travel time is defined as off-peak travel time, then the measured delay is difference between the actual measured travel time during peak period, and the actual measured travel time during off-peak period. If the ideal travel time is defined as travel at the posted speed limit, then the delay cannot be directly measured in the field. It is estimated by subtracting the hypothetical travel time at the posted speed limit from the measured mean travel time in the field.
In traffic detector information is derived from technologies divided into two main groups, information collected via in-situ detectors, deployed at location of interests, or information from mobile technologies that are located within vehicles themselves. Over the last two decades, there has been an increase in the provision of services that are specific to vehicle types, as well as fleet or asset management and tracking, based on in-vehicle technologies. In-vehicle technologies have really come into realization through the advantage of satellite-based technologies, and are perceived as playing an increasing role in the future.Such technologies not only improve our ability to manage networks efficiently, but will also have a direct impact of the types of policy instruments available to authorities, the operation of so-called ITS.
In-situ traffic detector technologies are further divided into two categories: Intrusive technologies that are physically mounted at, or below, the road surface, installation of which causes potential disruption to traffic. Conversely, non-intrusive technologies are mounted at, or above the road surface, and their installation causes little or no disruption to traffic. Detectors of both types temporary or permanent nature, though sub-surface intrusive installations are, by necessity, usually permanent. All in-situ detectors will provide some measure of the volume of vehicle flow. Particular detector technologies will vary as to their reliability of the flow estimate, and their ability to provide accurate additional information on vehicle category or speed. A single sensor gives only flow or occupancy information. Two adjacent sensors are required for speed or classification assessment. The time-lag and separation distance between the onset of consecutive events at the sensors have been used to estimate vehicle speed. Classification information is derived either from vehicle length or through examination of the form of the profile generated as output from the sensor.
Typical examples of intrusive technologies, their sensor types and installation locations are
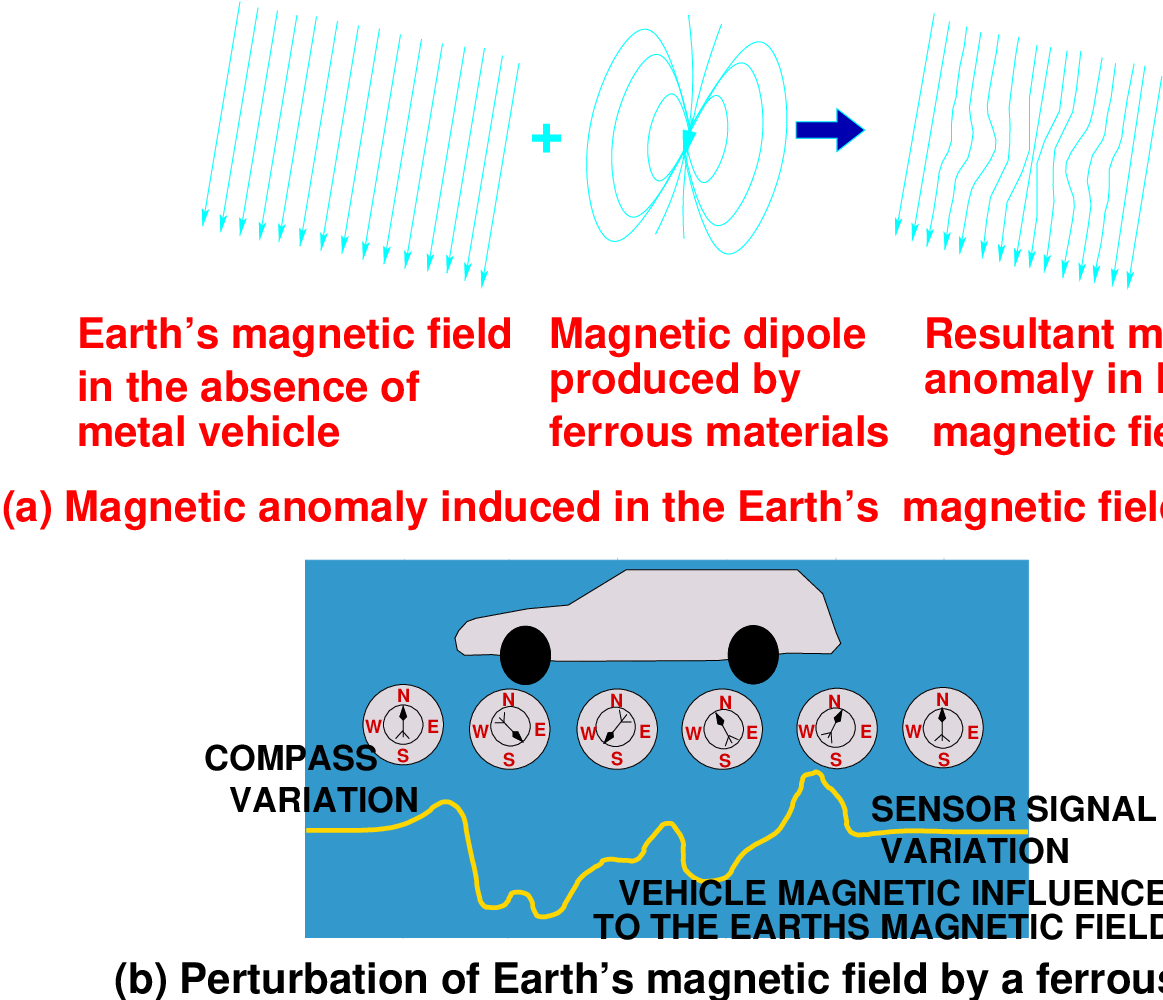
shown in Fig. 1. The first types of units (Fig. 1, Type 1) are passive magnetic or
magneto-meter sensors that are either permanently mounted within holes in the road, or
affixed to the road surface in some fashion. The unit communicates to a nearby base station
processing unit using either wires buried in the road, or wireless communications.
The sensor has a circular or elliptically offset zone of detection (i.e., the blue area).
The second types of units (Fig. 1, Type 2) use pneumatic tubes that are stretched across
the carriageway and affixed at the kerb side at both ends. Such systems are only be deployed
on a temporary basis, due to the fragile nature of tubes, which are easily damaged or torn up
by heavy or fast moving vehicles.
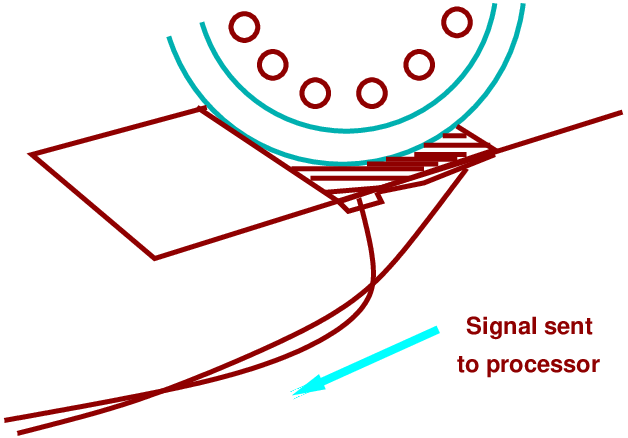
The third type (Fig. 1, Type 3) are inductive detector loops (IDL), consisting of coated wire
coils buried in grooves cut in the road surface, sealed over with bituminous filler. A cable
buried with the loop sends data to a roadside processing unit. The zone of detection for
inductive loop sensors depends on the cut shape of the loop slots. The zones depending on
the overall sensitivity of system not correspond precisely to the slot dimensions. IDLs
are a cheap and mature technology. They are installed on both major roads and
within urban areas, forming the backbone detector network for most traffic control
systems.
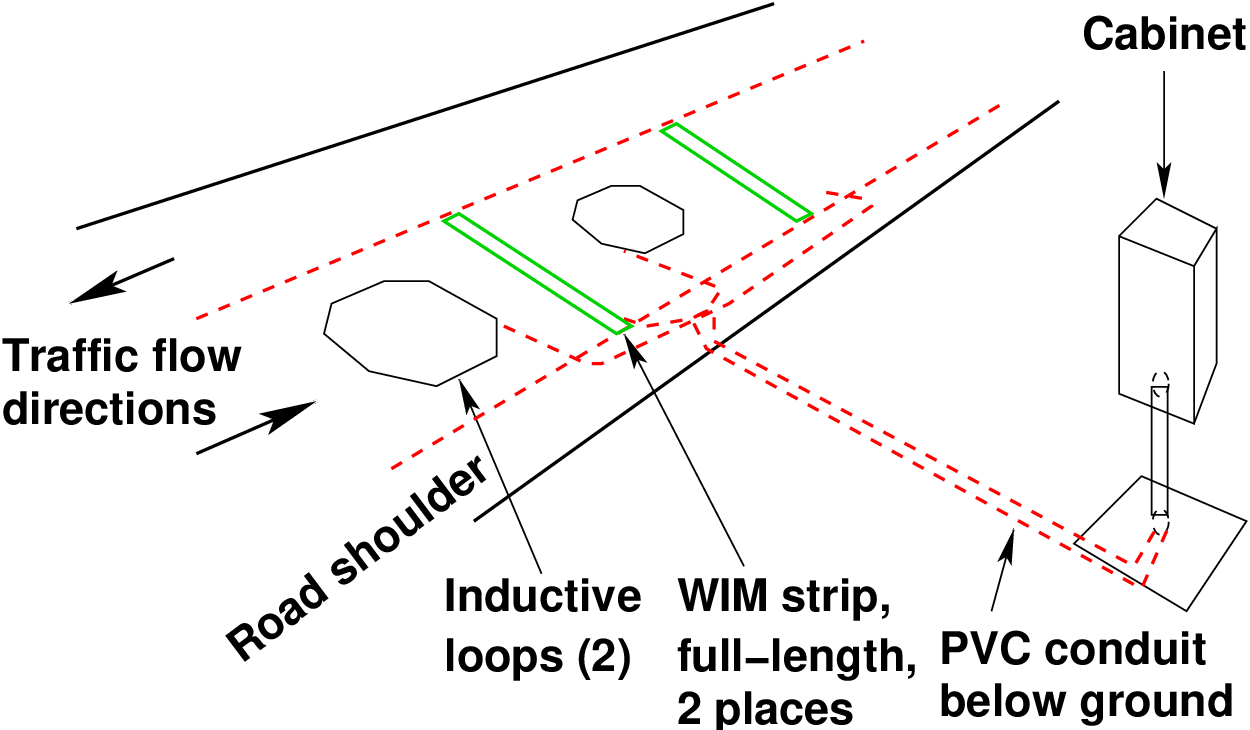
The fourth type of intrusive system is Weigh-In-Motion (WIM) shown in Fig. 2, detectors that
consist of a piezoelectric sensor (e.g. ‘bending-plate’ or fiber-optic) system laid in a channel
across the road. These systems are relatively rare and are used in specific locations
for enforcement or access control. They are usually coupled with other systems,
either intrusive or non-intrusive, to provide additional cross-checks on collected data.
Disadvantages
Disadvantages
Disadvantages
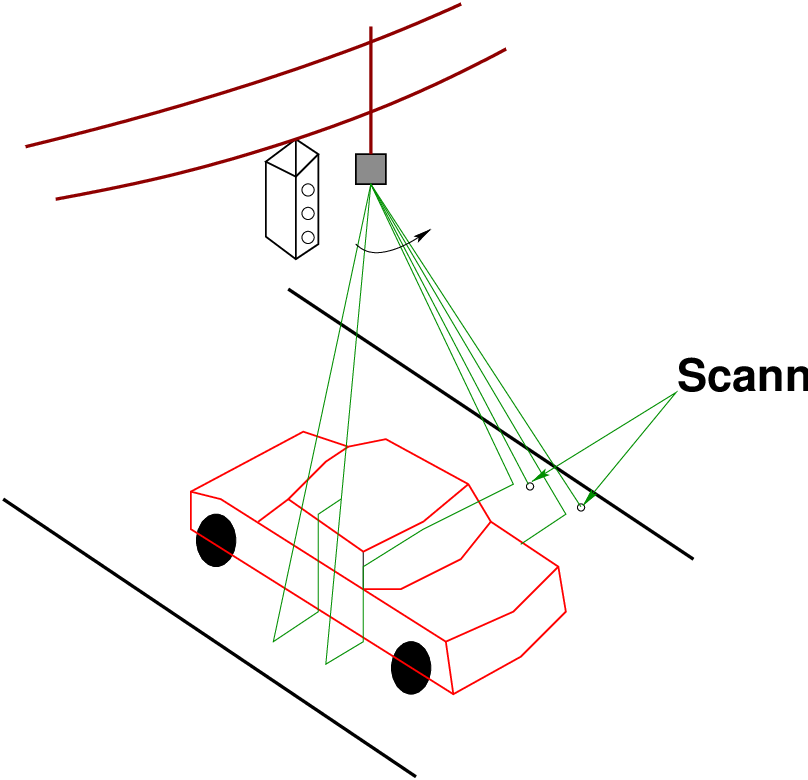
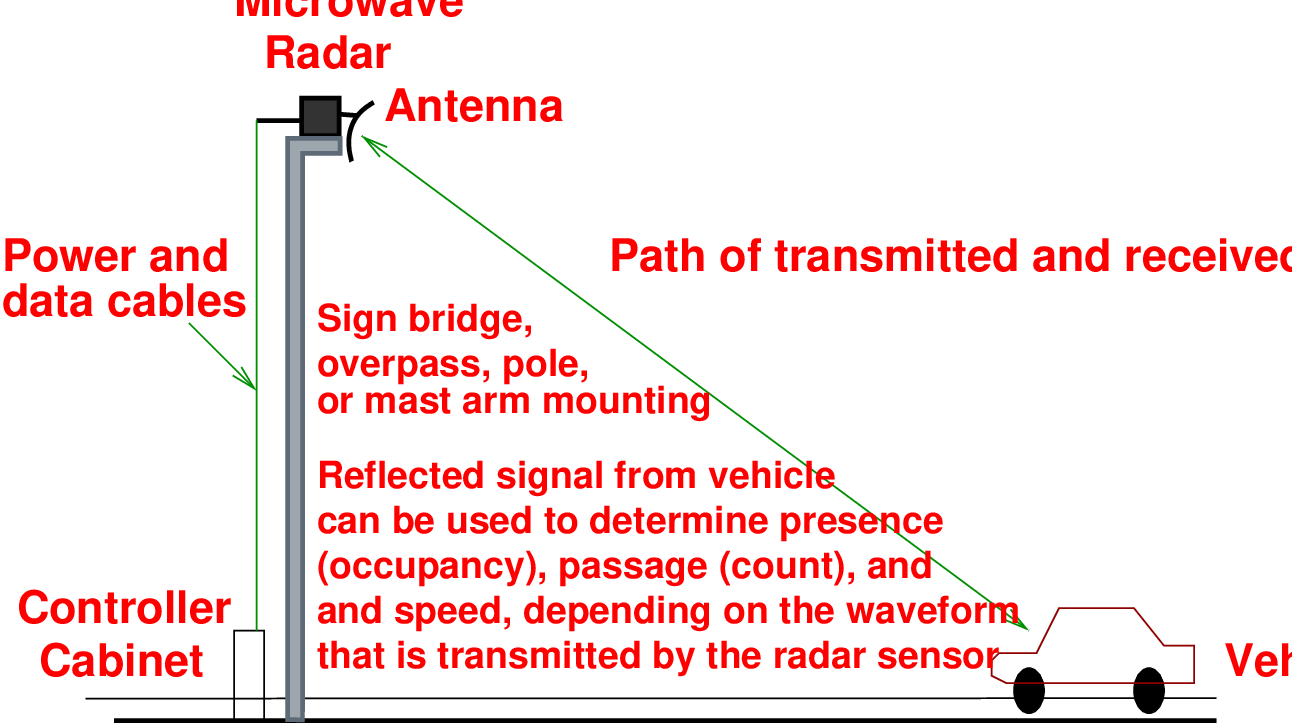
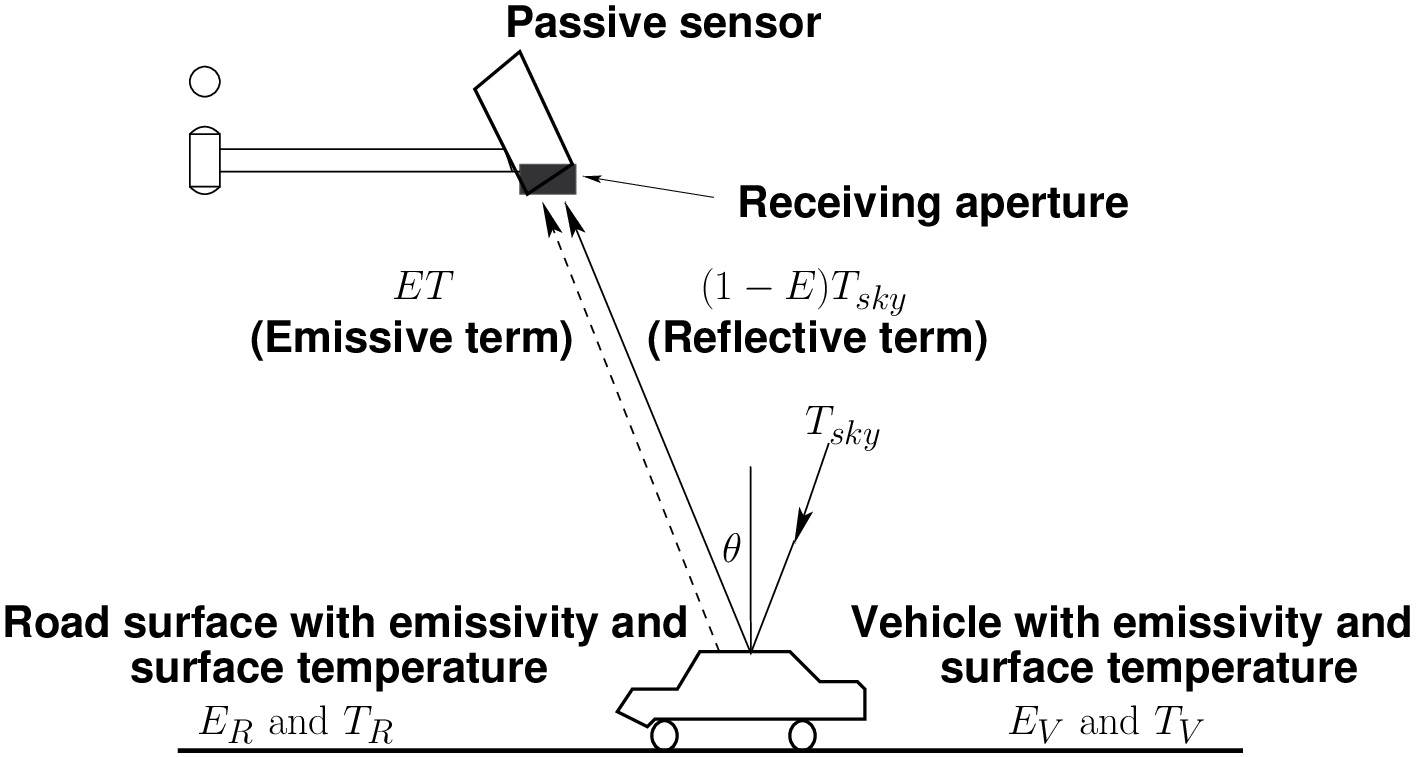
Non-intrusive technologies include video data collection, passive or active infrared detectors,
microwave radar detectors, ultrasonic detectors, passive acoustic detectors, laser detectors
and aerial photography. All these technologies represent emergent fields that are expanding
rapidly with continuing advances in signal processing. At present time such technologies
are used to provide supplemental information for selected locations or for specific
applications (e.g., queue detection at traffic signals). Most non-intrusive systems are
operationally and somewhat visually similar, consisting of small electronics unit
mounted in a weatherproof housing placed in various locations, as shown in Fig. 5.
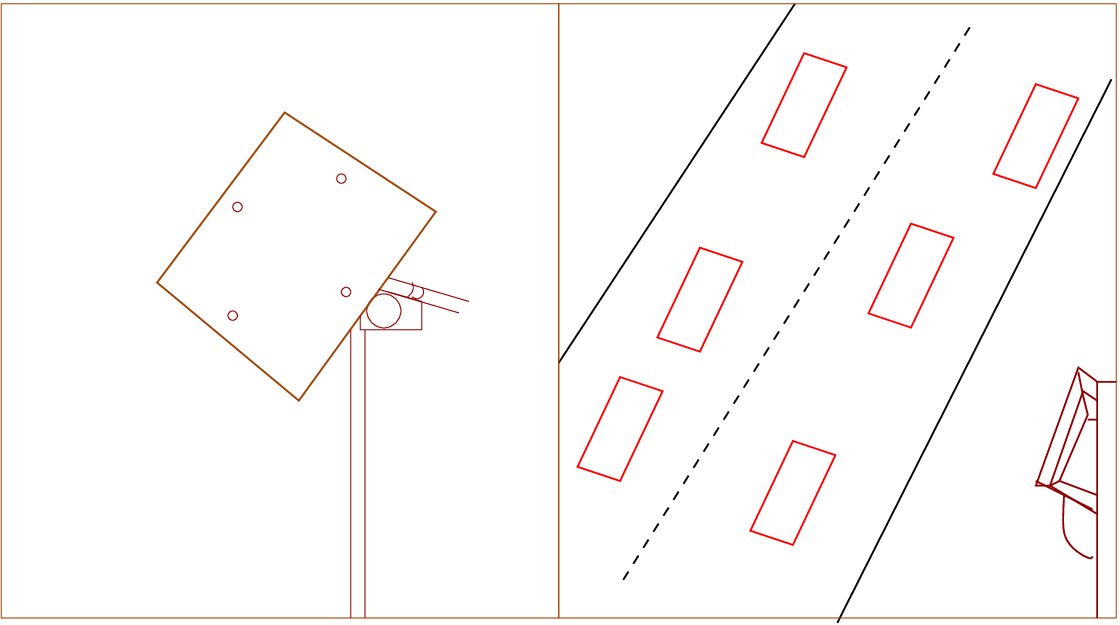
The first type of non-invasive detectors are roadside mast-mounted. The detector possesses
a field-of-regard covering an oblique area upstream or downstream of the unit. There are also
multiple zones of detection defined within the overall field of regard, or the overall zone of
detection same as the field of regard, depending on the specific detector type and technology.
Obscuration problems occur when high-sided vehicles screens lower vehicles from the
detector or the field-of-view being too large, leading to detection of vehicles outside the
desired lane.
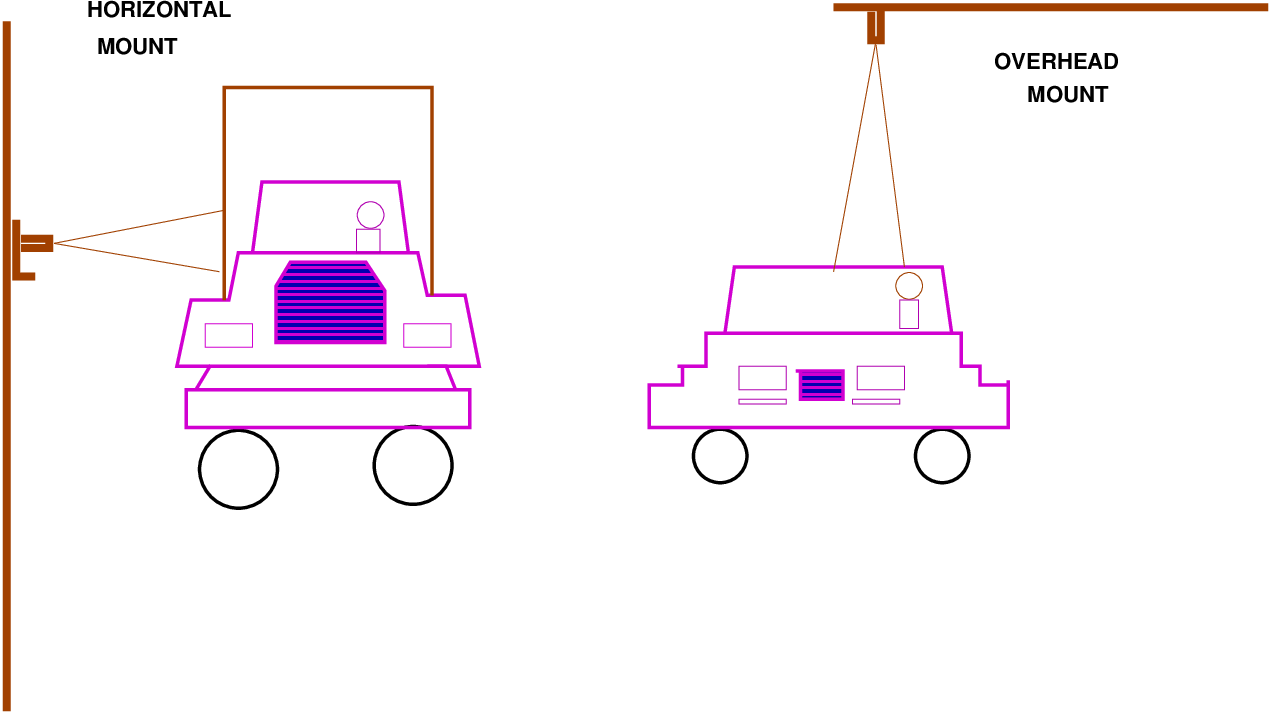
The second type of non-invasive detectors are mounted on gantries or bridge undersides, with field of regard directly below, or at a slight oblique to the unit. Finally, some units, such as open-path pollutant monitors are mounted road side at ground level, firing a beam across the road. Such units are subject to side-by-side masking and hence most suitable for only single lane, unidirectional flows.
Advantages
Disadvantages
Disadvantages
Disadvantages
Disadvantages
Disadvantages
In addition to using in-situ technologies, many network management applications make use of
in-vehicle devices, generically termed Automatic Vehicle Location (AVL) systems. AVL
devices either provide positional information whenever a suitably equipped vehicle
passes a certain point in the network, or continuous information as the vehicle travels
through a network. The former system typically relies on appropriate vehicles being
equipped with transponders which transmit and receive information from roadside units.
The latter system uses vehicles equipped with Global Positioning System (GPS)
technology.
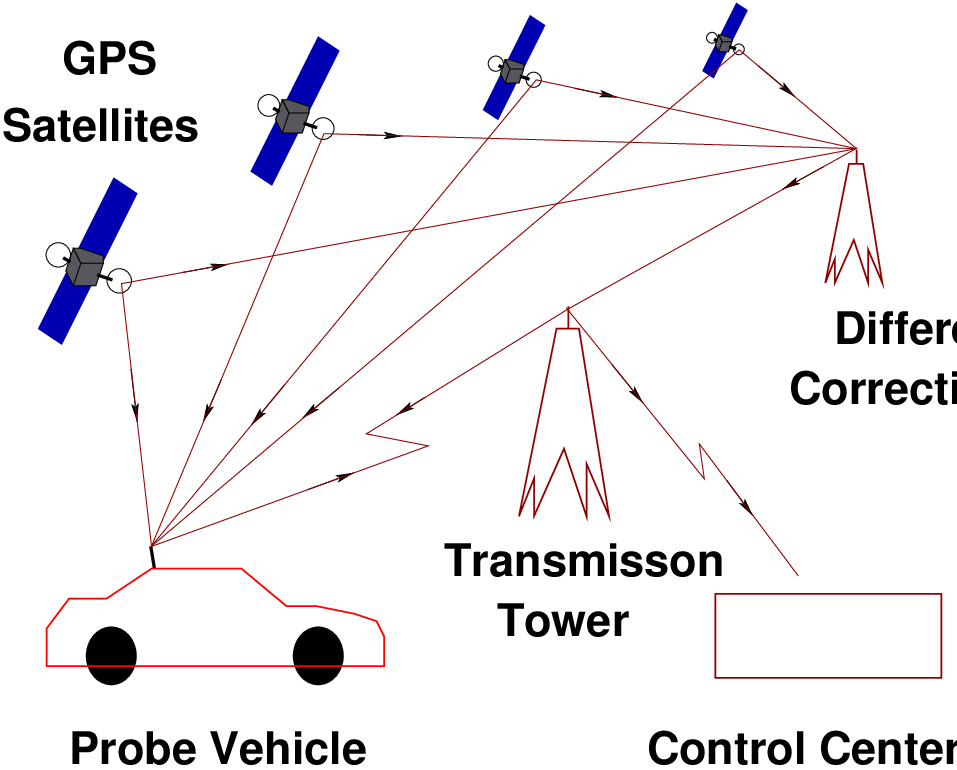
The principle of FCD is to collect real-time traffic data by locating the vehicle via mobile
phones or GPS over the entire road network as shown in Fig. 11. It represents that all
vehicles are equipped with mobile phone or GPS which will act as a sensor for the
road network. Data such as car location, speed and direction of travel are sent
anonymously to a central processing centre. After collecting and extracting, useful
information such as status of traffic and alternative routes it can be redistributed to the
drivers on the road. FCD is an alternative or rather complement source of high
quality data to existing technologies. They will help improve safety, efficiency and
reliability of the transportation system. They are becoming crucial in the development of
ITS.
GPS is becoming more and more useful and inexpensive; few cars had been equipped with
GPS system and were made to pass a certain point in the network. The vehicle location
precision was found to be relatively high, typically less than 30m. Generally, traffic data
obtained from private vehicles or trucks are more suitable for motorways and rural
areas.
Currently, GPS probe data are widely used as a source of real-time information by many service providers but it suffers from a limited number of vehicles equipped and high equipment costs compared to floating cellular data.
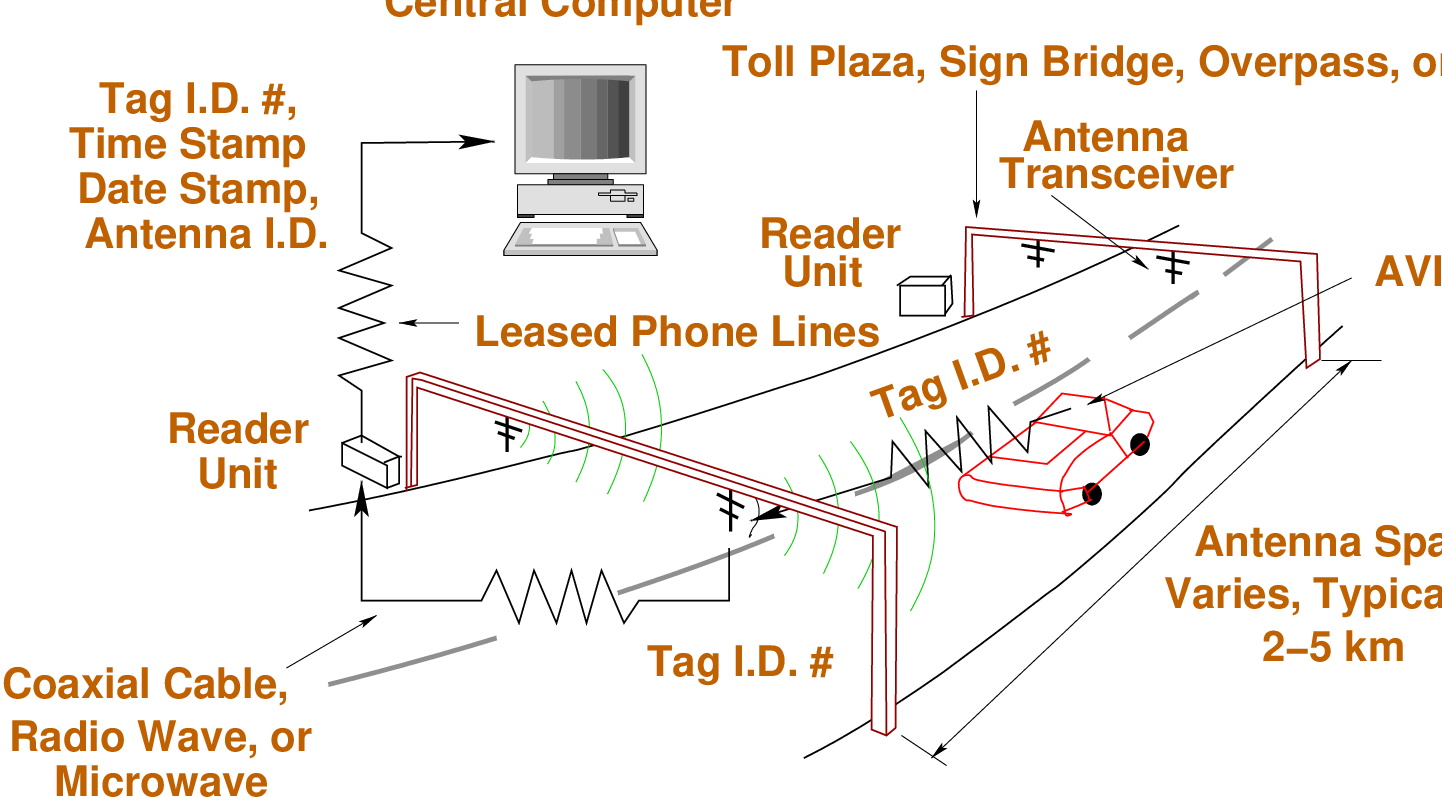
Radio-frequency identification (RFID) is an automatic identification method, relying on storing
and retrieving data from remote areas using devices called RFID tags or transponders. The
technology requires some extent of cooperation of an RFID reader and an RFID
tag. An RFID tag is an object that can be applied to or incorporated into a product,
animal, or person for the purpose of identification and tracking using radio waves.
Some tags can be read from several meters away and beyond the line of sight of the
reader.
A basic RFID system consists of three components
An RFID tag is comprised of a microchip to collect information and an antenna that transmits
this data wireless to a reader. At its most basic, the chip will contain a serialized
identifier, or license plate number, that uniquely identifies that item. Typically, processed
data would be used to provide revised scheduling and arrival time information to
the general public, via variable information signs. Transponder systems are also
used with Selective Vehicle Detection (SVD) systems which are designed to allow
priority at traffic signals or cordon points for public transport or emergency service
vehicles.
Typical Applications for RFID
Advantages
Disadvantages
Travel time, or the time required to traverse a route between any two points of interest, is a fundamental measure in transportation. Travel time is a simple concept understood and communicated by a wide variety of applications for transportation engineers and planners. Several data collection techniques can be used to collect travel times. These techniques are designed to collect travel times and average speeds on designated roadway segments or links.
Following are the different techniques available for the travel time data collection.
Travel time data using active test vehicles in combination with varying levels of
instrumentation: manual (clipboard and stopwatch), an electronic distance measuring
instrument (DMI), or a global positioning system (GPS) receiver. It involves the use of
data collection vehicle within which an observer records cumulative travel time at
predefined checkpoints along a travel route. Then this information converted to travel
time, speed, and delay for each segment along the survey route. There are several
different methods for performing this type of data collection, depending upon the
instrumentation used in the vehicle. These vehicles are instrumented and then sent into the
field for travel time data collection, they are sometimes referred to as “active” test
vehicles.
Advantages
Disadvantages
Travel times by matching vehicle license plates between consecutive checkpoints with varying
levels of instrumentation: tape recorders, video cameras, portable computers, or automatic
license plate character recognition.
Advantages
Disadvantages
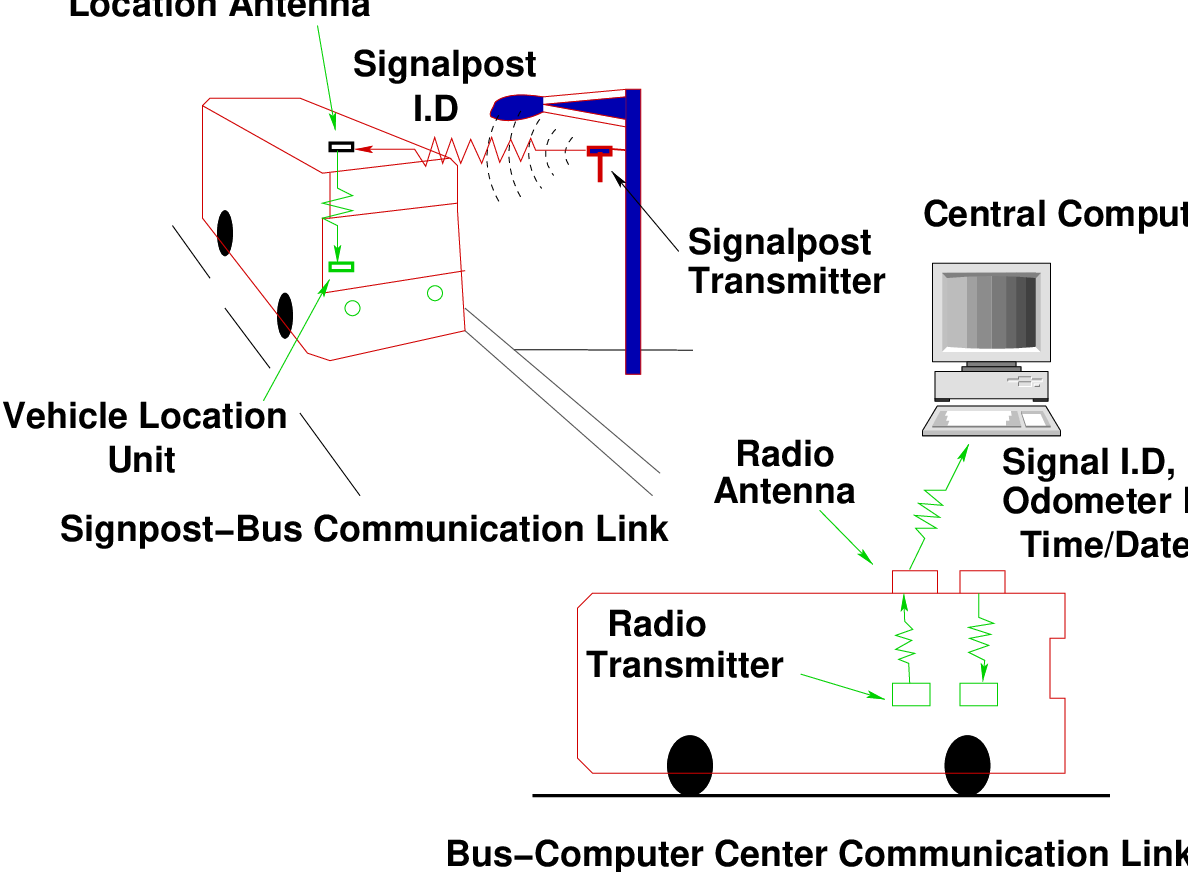
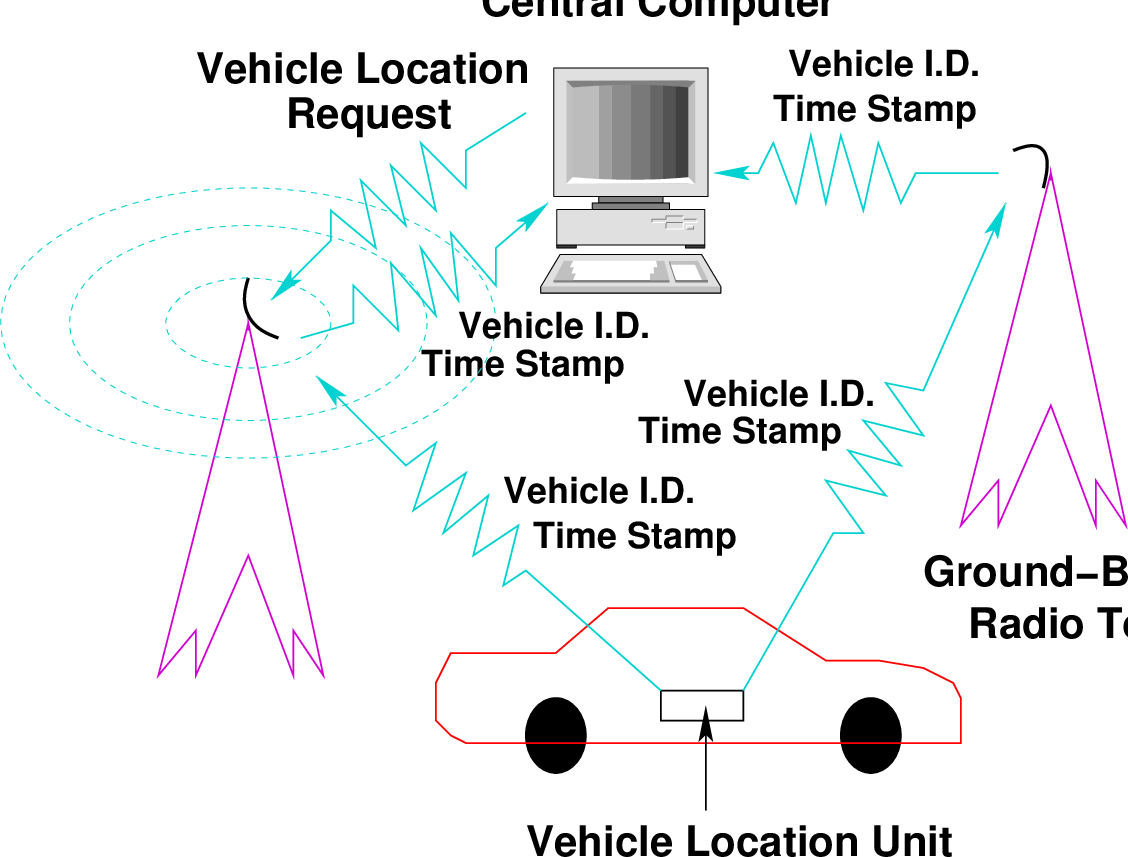
Travel times using ITS components and passive probe vehicles in the traffic stream equipped
with signpost-based transponders, automatic vehicle identification (AVI) transponders,
ground-based radio navigation, cellular phones, or GPS receivers.
Some vehicles are equipped with dynamic route guidance (DRG) device which act as roving
traffic detectors, a non-infrastructure based traffic monitoring system. Such vehicles, which
are participating in the traffic flow and capable of determining experienced traffic
conditions and transmitting these to a traffic center, are called probe vehicles. To
determine its position and to register experienced traffic conditions, a probe vehicle is
equipped with on-board electronics, such as a location and a communication device. By
means of the location device, the probe vehicle keeps track of its own geographic
position.
Through the communication device, the probe vehicle transmits its traffic experiences via a
mobile communication link to a traffic center. For instance, each probe can transmit traffic
messages once every time interval containing its location and its speed at the instant of
transmission. In this traffic center the traffic data received from probe vehicles is gathered,
and combined with data from the other monitoring sources, and processed into relevant
traffic information. It is very useful for Advanced Traveler Information system (ATIS).
Advantages
Disadvantages
ITS probe vehicle data collection systems
Disadvantages
ITS include sensor, communication, and traffic control technologies. Intelligence requires
information, and information requires data, which is generated by surveillance. Vehicle
detection and surveillance technologies are an integral part of ITS, since they gather all or
part of the data that is used in ITS. A detailed introduction and importance of ITS and different
types of data involved have been discussed in this chapter. Technology regarding the data
collection techniques on conventional and non conventional methods has been presented in
the following chapter.
A detailed different technology system, their principles, advantages, disadvantages and type
of data collected by each system have been discussed in this chapter. Application part of
travel time by probe vehicle and vehicle signature by some technologies has been
presented.
Detailed travel time estimation by different techniques has been discussed in this chapter.
Also travel time estimation by vehicle technology and emerging techniques such as vehicle
signature have also been discussed in this chapter.
Each detector technology and particular device has its own limitations and individual
capability. The successful application of detector technologies largely depends on proper
device selection. Many factors impact detector selection, such as data type, data accuracy,
ease of installation, cost and reliability. Vehicle technologies are well advanced compared to
the in-situ technology detectors for travel time. A non- Intrusive technology is very effective
compared to the Intrusive technologies. Pneumatic road tube sensors are more
suitable for small sample and short duration period but it can’t detect two wheelers.
ILD’s are flexible to satisfy different variety of applications, but installation requires
pavement disturb. Magnetic sensors provide traffic measurements more accurate and
more informative than loop detector measurements, but it can’t detect the stopped
vehicle.
I wish to thank several of my students and staff of NPTEL for their contribution in this lecture. I also appreciate your constructive feedback which may be sent to tvm@civil.iitb.ac.in
Prof. Tom V. Mathew
Department of Civil Engineering
Indian Institute of Technology Bombay, India
_________________________________________________________________________
Thursday 31 August 2023 12:12:19 AM IST