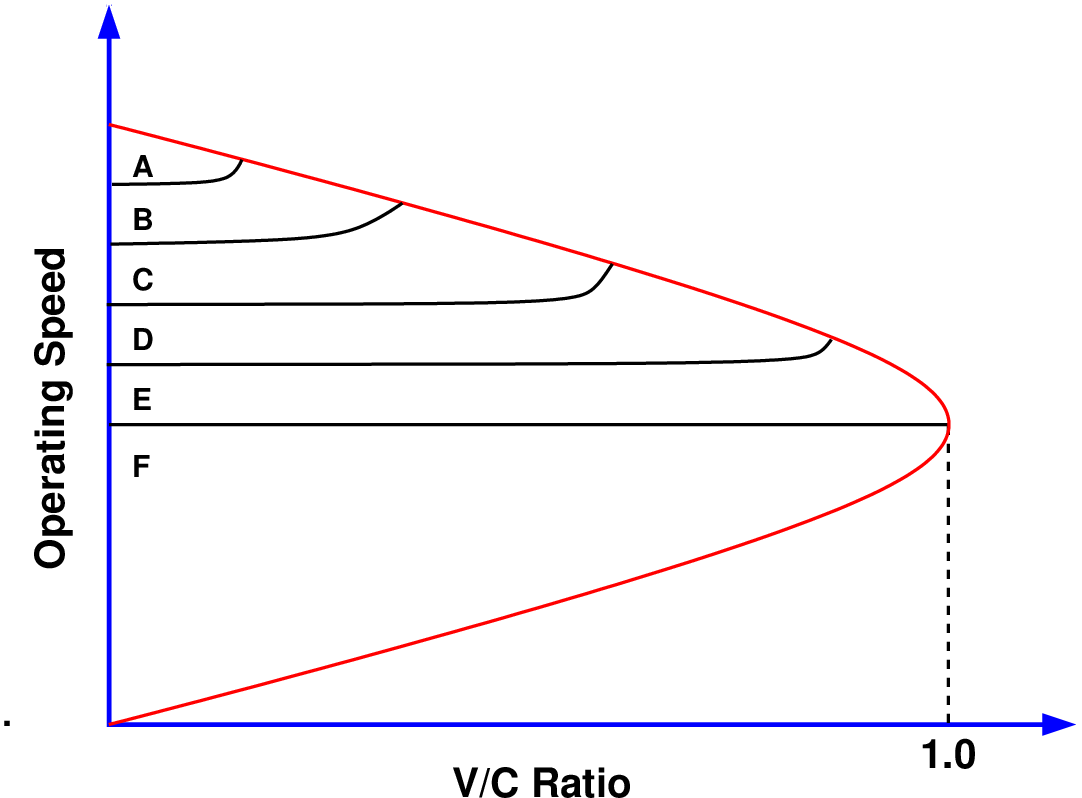
Figure 1: The Level of Service of a mid-block section is expressed in terms of the
operaing speed and volume to capacity (v/c) ratio
Often it is required to ascertain how much a transport facility can accommodate. Such information is useful in the design of traffic facility. Capacity analysis helps in answering the question. It is a quantitative assessment of the ability of a traffic facility to handle vehicles or people for which it is designed.
A related question is, what is the performance level of the system at various operating conditions. Or in other words, how good is the operation of the traffic facility. Level of Service analysis tries to answer this question which is essentially a qualitative analysis. Capacities and Level of Services are therefore closely related analysis of a traffic facility.
Capacity of a transport facility is defined as the maximum number of vehicles, passengers, or the like, per unit time which can be accommodated under given conditions with a reasonable expectation of occurrence. The Highway Capacity Manual(2010) defines the capacity as the maximum howdy rate at which persons or vehicles can be reasonably expected to traverse a point or a uniform segment of a lane or roadway during a given time period, under prevailing roadway, traffic and control conditions. Several observations can be made from the above definition. Although capacity is the maximum howdy rate, in many situations the break 15 minute flow rate is expressed as the capacity. The above definition also contains the term “reasonably expected” to account for the variation in traffic and driving habit at various location. However, it can be termed as a probabilistic measure. Further, analytical derivations are possible for getting the maximum flow rate, seldom it is achieved in the field. However, capacity measures are often empirically derived. Capacity is usually defined for a point or a uniform segment where operating conditions do not vary.
The capacity measure depends on these operating conditions. The first is the traffic conditions and the factors that influence the capacity includes vehicle composition, turning, movements, etc. The second factor is the roadway conditions and it includes geometrical characteristics such as lane width, shoulder width, horizontal alignment, vertical alignment. The third factor is the control conditions such as the traffic signal timings, round-about characteristics. It is also to be noted that the above capacity definition holds good for a point or at a section of the road having uniform control conditions. Another aspect of the above capacity definition is the expression that the maximum flow rate which accounts for the worst 15 minutes traffic within the peak hour traffic. Lastly the term reasonable expectancy indicates that the capacity measure is probabilistic and not an analytically derived deterministic value. The capacity measure is probabilistic, for it accounts for the unexplainable variation in traffic and diverse driving characteristics.
Level-of-Service(LOS) of a traffic facility is a concept introduced to relate the quality of traffic service to a given flow rate. Level-of-Service is introduced by HCM to denote the level of quality one can derive from a local under different operation characteristics and traffic volume. HCM proposes LOS as a letter that designate a range of operating conditions on a particular type of facility. Six LOS letters are defined by HCM, namely A, B, C, D, E, and F, where A denote the best quality of service and F denote the worst. These definitions are based on Measures of Effectiveness(MoE) of that facility. Typical measure of effectiveness include speed, travel-time, density, delay etc. There will be an associated service volume for each of the LOS levels. A service volume or service flow rate is the maximum number of vehicles, passengers, or the like, which can be accommodated by a given facility or system under given conditions at a given LOS.
HCM has developed the capacities standard and LOS measure for various facilities. Each traffic facility has its own unit for the capacity and measure of effectiveness for each item will also vary. The traffic facilities can be divided into three, namely: the uninterrupted facilities, interrupted facilities, and others. Interrupted facilities include freeway (basic freeway, weaving sections, and ramps), multi-lane highways (unidirectional), two-lane highways(bidirectional). Freeways normally have density as the measure of effectiveness, while multi-lane and two-lane highways have delay/speed as the MoE. Interrupted facilities include un-signalized intersection, signalized intersection, and arterials or corridors. They have respectively control delay, total delay and average travel speed as the measure of effectiveness. Other facilities may include pedestrian pathways, bicycle tracks, bus-transit system, rail-transit system and air-transportation system. Each of them have facility specific measure of effectiveness.
For a typical freeway mid block section the capacity and LOS can be defined for an ideal section. An ideal section has uninterrupted flow from both sides and has only passenger cars and the drivers are regular travelers who are familiar with the facility. The lane width is 3.65m wide with proper shoulder and 1.8m lateral clearance is available from the edge of the pavement. The free flow speed of 115kmph is achievable on the multi-lane and 100kmph on the two-lane highway.
Such a facility is considered as an ideal facility and for such facilities the following values can be taken as capacity.
Note that the above values are not analytical or experimentally derived, but, statistically derived from the observed field values from large number of such sections. Needly to say that it is possible to have a flow higher than this capacity measure, but not necessary.
The above capacity value drop due to various ‘non-ideal condition’ which includes changes in speed or travel time, traffic interruptions or restriction etc. Accordingly HCM has defined various levels of services for the traffic facility. Assigning quality value is based on several user surveys capturing the perception of drivers on the quality of the traffic under various operating condition. The Figure 1 illustrate the quality of services or Level-of-Services (A to F) and the various operating conditions.
The same can be shown in the Table 1.
| LOS | Quality | Speed | V/C | Description |
| (kmph) | ||||
| A | Free-flow | 80 | 0.6 | High level of physical |
| and psychological comfort | ||||
| B | Reasonable | 70 | 0.7 | Reasonable level of |
| free-flow | physical and psychological comfort | |||
| C | Near | 60 | 0.8 | Local deterioration |
| free-flow | possible with blockages | |||
| D | Medium | 50 | 0.85 | Non-recoverable |
| flow | local disruptions | |||
| E | At capacity | 40 | 0.9 | Minor disturbances |
| flow | resulting breakdown | |||
| F | Congested | 15 | 1.0 | Break down of flow |
| flow | capacity drops | |||
In this lecture the concepts of capacity and LOS is presented. Capacity is a quantitative measure, whereas LOS is a qualitative measure. Capacity defined for various traffic facilities considering the traffic, geometric and control condition and obtained from field observation. LOS on the other side is assigning quality levels of traffic based on performance measure like speed, density, etc. Together, the concepts gave planner a valuable tool in designing and evaluating various traffic facilities.
I wish to thank several of my students and staff of NPTEL for their contribution in this lecture. I wish to thank especially my staff Ms. Reeba in typesetting the materials for this lecture. I also appreciate your constructive feedback which may be sent to tvm@civil.iitb.ac.in
Prof. Tom V. Mathew
Department of Civil Engineering
Indian Institute of Technology Bombay, India
_________________________________________________________________________
Wednesday 27 September 2023 10:43:58 PM IST