Traffic signals are designed to ensure safe and orderly flow of traffic, Protect pedestrians and vehicles at busy intersections and reduce the severity and frequency of accidents between vehicles entering intersections. Previous chapters discussed some important design principles such as: (i) Phase Design (ii) Cycle Time Determination (iii) Green Splitting (iv) Performance Evaluation This chapter we will discuss some special requirements in the signal design such as: (i) Pedestrian crossing requirement (ii) Interval design, (iii) Effect of tuning vehicles, and (iv) Lane utilization.
Pedestrian crossing requirements can be taken care by two ways; by suitable phase design or by providing an exclusive pedestrian phase. It is possible in some cases to allocate time for the pedestrians without providing an exclusive phase for them. For example, consider an intersection in which the traffic moves from north to south and also from east to west. If we are providing a phase which allows the traffic to flow only in north-south direction, then the pedestrians can cross in east-west direction and vice-versa.
However in some cases, it may be necessary to provide an exclusive pedestrian phase. In such cases, the procedure involves computation of time duration of allocation of pedestrian phase. Green time for pedestrian crossing Gp can be found out by,
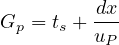 |
where Gp is the minimum safe time required for the pedestrians to cross, often referred to as the pedestrian green time, ts is the start-up lost time, dx is the crossing distance in meters, and up is the walking speed of pedestrians which is about 15th percentile speed. The start-up lost time ts can be assumed as 4.7 seconds and the walking speed can be assumed to be 1.2 m/s.
There are two intervals, namely the change interval and clearance interval, normally provided in a traffic signal.
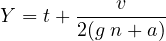
The change interval or yellow time is provided after green time for movement. The purpose is to warn a driver approaching the intersection during the end of a green time about the coming of a red signal. They normally have a value of 3 to 6 seconds. The design consideration is that a driver approaching the intersection with design speed should be able to stop at the stop line of the intersection before the start of red time. Institute of transportation engineers (ITE) has recommended a methodology for computing the appropriate length of change interval which is as follows:
 | (1) |
where t is the reaction time (about 1.0 sec), v is the velocity of the approaching vehicles, g is the acceleration due to gravity (9.8 m/sec2), n is the grade of the approach in decimals and a is the deceleration of Change interval can also be approximately computed as y = SSD/v, where SSD is the stopping sight distance and v is the speed of the vehicle. The clearance interval is provided after yellow interval and as mentioned earlier, it is used to clear off the vehicles in the intersection. Clearance interval is optional in a signal design. It depends on the geometry of the intersection. If the intersection is small, then there is no need of clearance interval whereas for very large intersections, it may be provided.
The clearance interval or all-red will facilitate a vehicle just crossed the stop line at the turn of red to clear the intersection without being collided by a vehicle from the next phase. ITE recommends the following policy for the design of all read time, given as
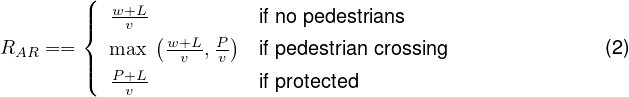
Right-turn signal phases facilitate right-turning traffic and may improve the safety of the intersection for right-turning vehicles. However, this is done at the expense of the amount of green time available for through traffic and will usually reduce the capacity of the intersection. Right-turn arrows also result in longer cycle lengths, which in turn have a detrimental effect by increasing stops and delays. While phases for protected right-turning vehicles are popular and commonly requested, other methods of handling right-turn conflicts also need to be considered. Potential solutions may include prohibiting right-turns and geometric improvements. The three criteria for right -turn phase is presented below:
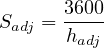
So the right turning vehicles affected saturation flow based on adjusted saturation headway. Finally actual values of right turning are calculated from right turn adjustment factor. The adjustments factor is calculated by following equations. Adjusted saturation headway,
 |
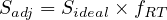
Adjusted saturation flow,
 |
Multiplicative right turn adjustment factor,
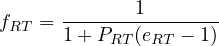 |
 |
If there is 15 percent right turning movement, eRT (through-car equivalent for permitted left turns) is 3, saturation headway is 2 sec; Find the value of Adjusted Saturation flow.
Solution: Given hideal = 2 sec, PRT = 15%(0.15), Sideal = 1800, eRT = 3
Case 1: Find adjusted saturation headway as:
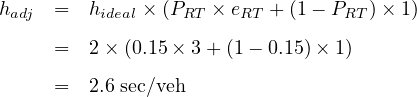
 =
=  = 1385. The adjusted saturation flow
is 1385 vph.
= 1385. The adjusted saturation flow
is 1385 vph.
Case 2 Find the adjustment factor to calculate adjusted saturation flow based on ideal saturation flow (1800)
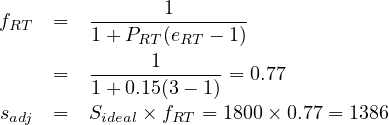
Lft turn adjustment factor for saturation flow rate is as follows: For exclusive lane fLT is 0.85 and for shared lane fLT = 1.0 - 0.15 PLT, where pLT is the proportions of left turns in lane group. Normally in left turn, separate signal phase are not provided at intersection as per Indian standard.
Congestion and Delay at intersection particularly formed by to too many vehicles are moving same lane. So reduce that problem, we need to provide lane distribution. The lane distribution at intersection normally followed two categories.
First one is the total volume of given approach are distributed by providing separate lane for left, right and through movement. For that individual movement, we need to fix some percentage of total flow at that particular approach. This type clearly defined in Figure 5 and following example.
In second type, the given approach total volumes are separated by individual lane for left, right and straight. And straight moving vehicles also distributed into left and right turn lanes for unavoidable condition. If through movement vehicles are high, we need to follow second type distribution. Second type is explained in Figure 6 and example. Normally high straight cases we followed second method. In that second type divided into two distribution methods. First one is, through movement distributed into left, right and straight lanes. Second is, extra separate lane provide for through movement. So each cases some lane distribution factors are followed. That importance points are shown in following examples.
Find Critical Volume (Vi) for a Given 4 arm Intersection. Traffic flow Proportion of Left and Right turn are 10% and 20% respectively (For all approach). Left and Right turn Lane utilization factors are 0.2 and 0.3 respectively.
Lane Distribution
From East to west,
Lane Distribution
From North to south,
From south to North,
V i = V 1 + V 2 + V 3 + V 4 = 804 + 695 + 871 + 1071 = 3442 veh∕hr
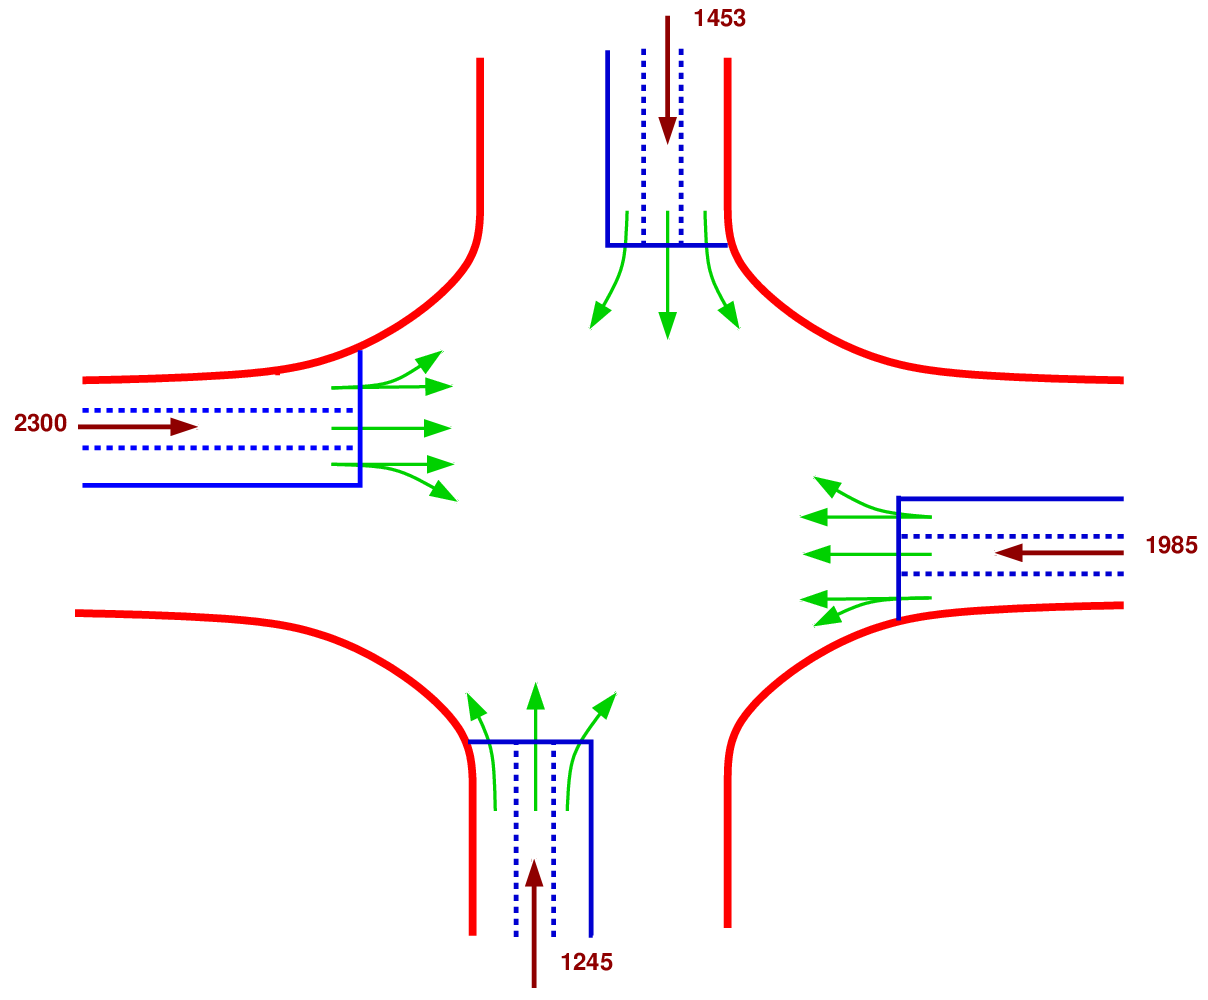
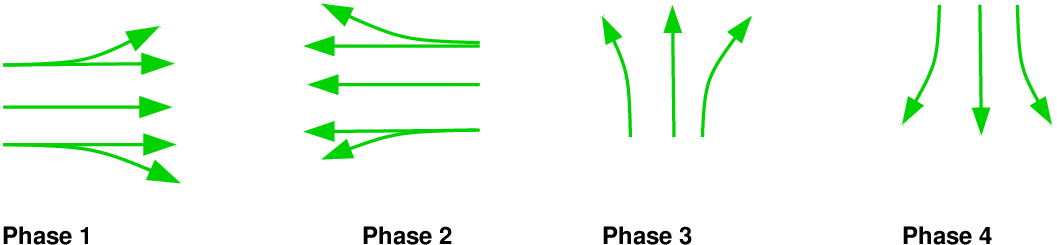
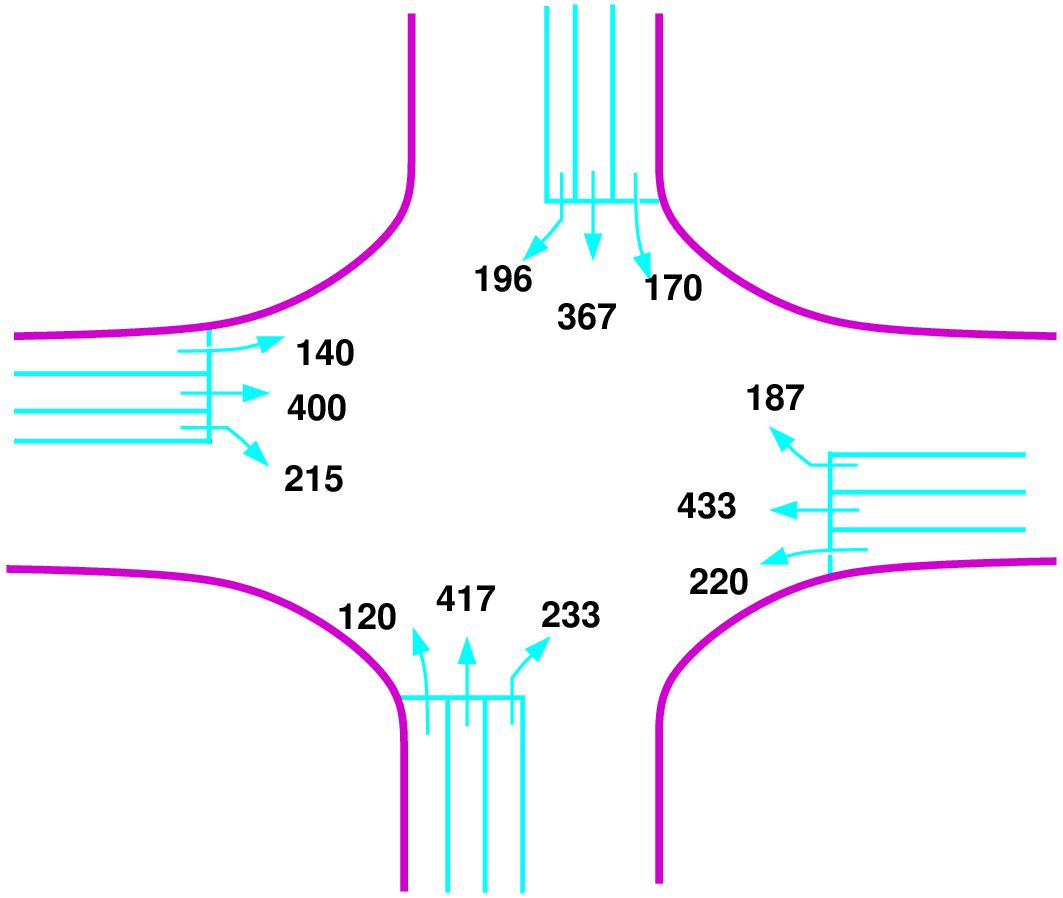
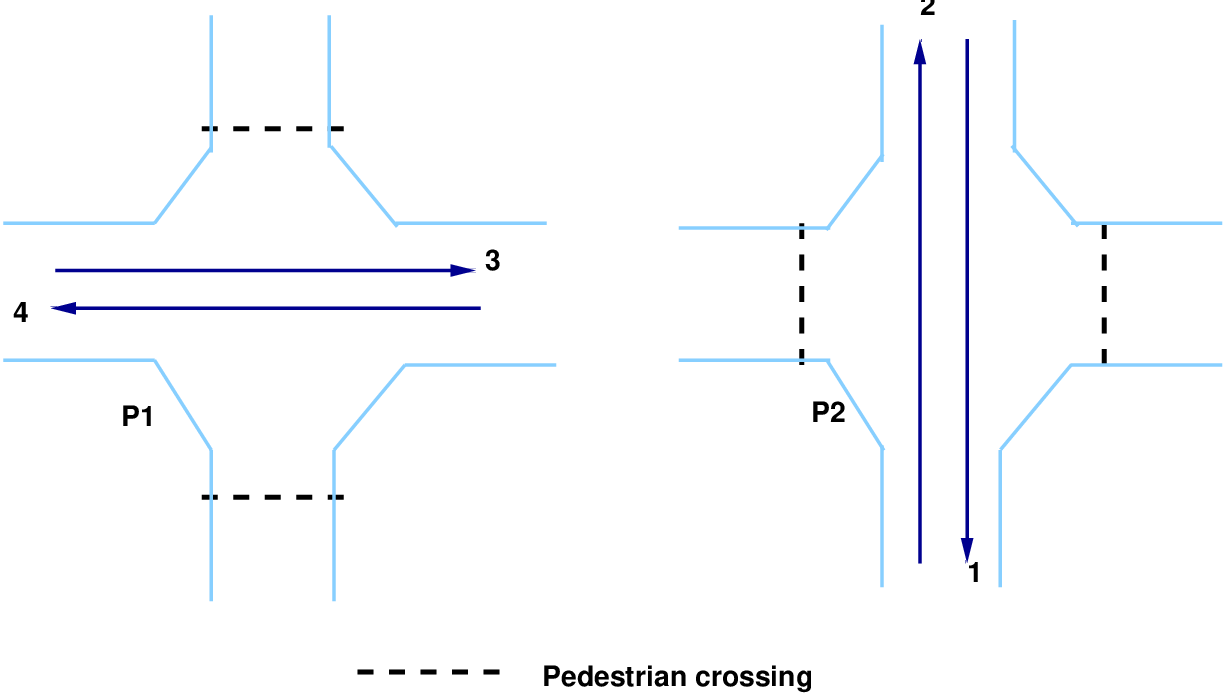
The traffic flow for a four-legged intersection is as shown in figure 3.
Given that the lost time per phase is 2.4 seconds, saturation headway is 2.2 seconds, amber time is 3 seconds per phase, find the cycle length, green time and performance measure(delay per cycle). Assume critical v∕c ratio as 0.9.
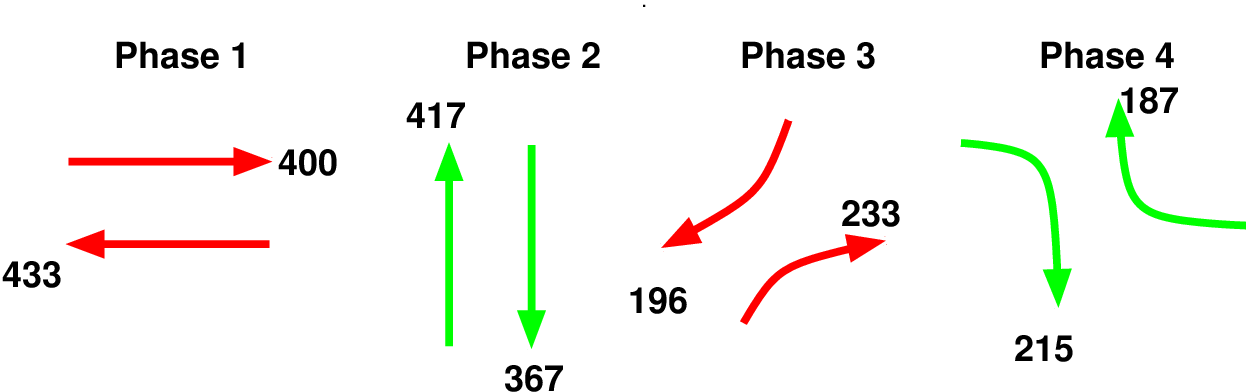
Sum of critical lane volumes is the sum of maximum lane volumes in each phase, ΣV Ci = 433+417+233+215 = 1298 vph.
 = 1637 vph.
  =
=  +
+  +
+  +
+  =
0.793.
=
0.793.
 = 80.68 seconds ≈ 80
seconds.
= 80.68 seconds ≈ 80
seconds.
 × (C - L) = 80-(4×2.4)= 70.4
seconds, where L is the lost time for that phase = 4× 2.4.
× (C - L) = 80-(4×2.4)= 70.4
seconds, where L is the lost time for that phase = 4× 2.4.
 ] = 22.88
seconds.
] = 22.88
seconds.
 ] = 22.02 seconds.
 ] = 12.04 seconds.
 ] = 11.66 seconds.
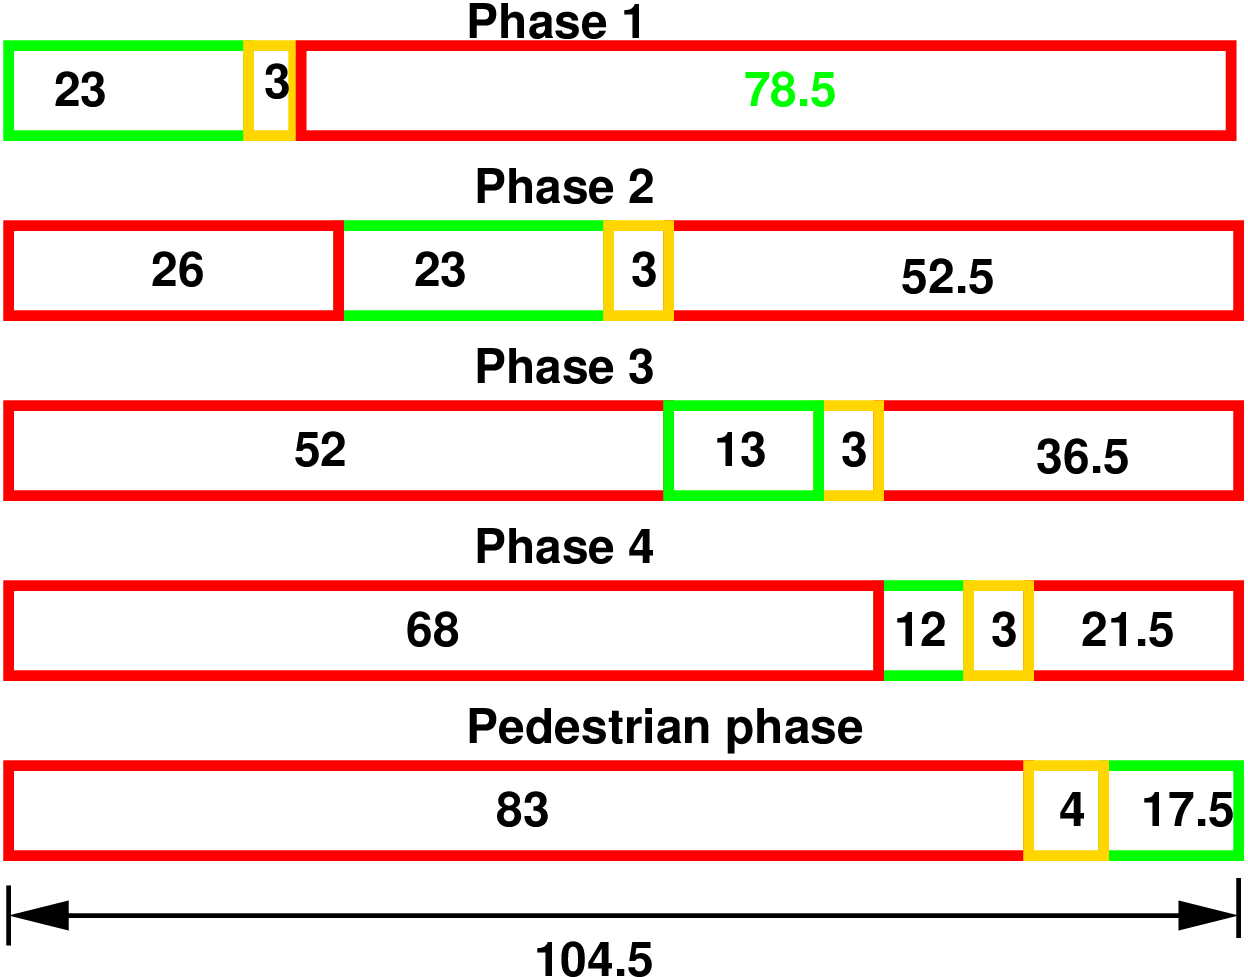
 = 21.5 seconds. The phase diagram is shown in figure 5.
 The actual cycle time will be the sum of actual green time plus amber time plus actual red time for any phase. Therefore, for phase 1, actual cycle time = 23+3+78.5 = 104.5 seconds.
![dEW = -1042.5[11---21346-13332047.4.+53]2= 42.57 sec∕cycle.](web24x.png) |
![-1042.5[1--23-1204.4.+53]2
dWE = 1- -400- = 41.44 sec∕cycle.
1637](web25x.png) | (3) |
![dNS = 1042.5[11---213366-10732.474.5+3]2-= 40.36 sec∕cycle.](web26x.png) | (4) |
![104.5 23-2.4+3
d = -2--[1----104.5-]2-= 42.018 sec∕cycle.
SN 1 - 4116377-](web27x.png) | (5) |
![dSE = -1042.5[11--13216-1332037.44.+53]2= 46.096 sec∕cycle.](web28x.png) | (6) |
![104.5[1 - 13--2.4+3]2
dNW = -2------119064.5----= 44.912 sec∕cycle.
1- 1637](web29x.png) | (7) |
![1042.5[1- 12-1024.4.5+3]2
dWS = -----1---215------= 46.52 sec∕cycle.
1637](web30x.png) | (8) |
![1042.5[1--12-1024.4.5+3]2-
dEN = 1- 1186737 = 45.62 sec∕cycle.](web31x.png) | (9) |
Green splitting is done by proportioning the green time among various phases according to the critical volume of the phase. Pedestrian phases are provided by considering the walking speed and start-up lost time. Like other facilities, signals are also assessed for performance, delay being th e important parameter used.
I wish to thank several of my students and staff of NPTEL for their contribution in this lecture. I also appreciate your constructive feedback which may be sent to tvm@civil.iitb.ac.in
Prof. Tom V. Mathew
Department of Civil Engineering
Indian Institute of Technology Bombay, India
_________________________________________________________________________
Thursday 28 September 2023 10:47:05 AM IST