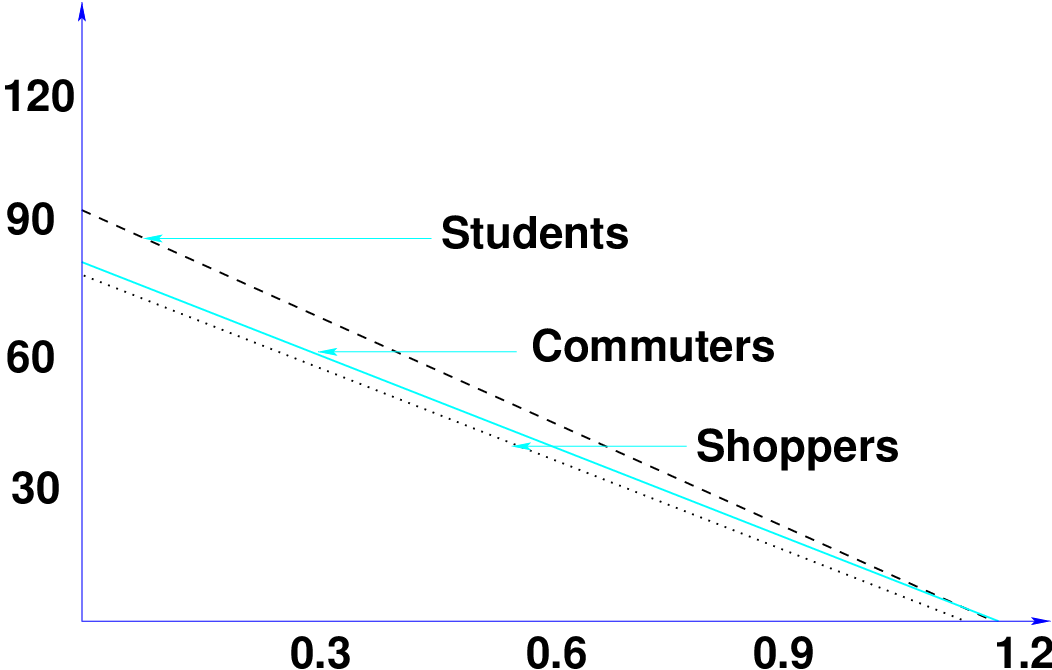
Figure 1: Relationship between pedestrian speed and density
People walk for many reasons: to go to a neighbour’s house, to run errands, for school, or to get to a business meeting. People also walk for recreation and health benefits or for the enjoyment of being outside. Some pedestrians must walk to transit or other destinations if they wish to travel independently. It is a public responsibility to provide a safe, secure, and comfortable system for all people who walk. In this lecture we will discuss about the pedestrian problems, pedestrian survey (data collection), characteristics, different level of services, and design principles of pedestrian facilities. There are many problems related to safety security of pedestrians. These are discussed below in brief.
Accidents Circumstances - Pedestrian accidents occurs in a variety of ways; the most common type involves pedestrian crossing or entering the street at or between intersections.
Special Problems
Any person afoot is the definition of Uniform Vehicle Code of pedestrian. However expand this definition to explicitly include people with disabilities, such as who use wheelchairs or other mobility devices. At the beginning and end of every motorist’s trip, he or she is pedestrian. The driver and/or passenger walks to the vehicle, which is parked, drives to a destination, parks the vehicle again, and walks to the final destination. In urban centers, pedestrian flows can be significant, and they must be accommodated in planning and design of traffic facilities and controls. Pedestrian safety is also a major issue, as the pedestrian is at a visible disadvantage where potential pedestrian-vehicle conflict exist, such as at the intersections.
It is important to recognize the forces influencing the demand for provision of more and better pedestrian facilities. Undoubtedly one important factor has been the increased awareness of the environmental problems created by the rapid national and worldwide growth in vehicle travel, but of equal important has been the recognition by many people of need for physical fitness and the role that play in achieving this.
The demand for pedestrian facilities is influenced by a number of factors of which some of the most important are
Before deciding on the appropriate extent and standard of pedestrian facilities, it is important to assess the potential demand. The possible methods of obtaining such estimates are manual count, video survey, and attitude survey described as follows.
Count the flow of pedestrian through a junction, across a road, or along a road section/footway manually using manual clicker and tally marking sheet. Manual counts need to satisfy the following conditions.
Advantages of this manual counting are that these are simple to set up and carry out, and flexible to response observed changes in demand on site and disadvantages are that these are labour intensive also simple information can be achieved and not detailed information.
Cameras are setup at the selected sites and video recording taken of the pedestrians during the selected observation periods. A suitable vantage point for the camera is important. Such survey produces a permanent record of pedestrian movement and their interaction with vehicles. In it the record of behavior pattern is also obtained which helps in analyzing the crossing difficulties.
Detailed questionnaire requires enabling complete information about pedestrian’s origins and destination points, also can gather information on what new facilities, or improvements to existing facilities, need to be provided to divert trips to walking, or increase the current pedestrian activities.
In many ways pedestrian flow are similar to those used for vehicular flow because it can be described in terms of familiar variables such as speed, volume, rate of flow and density. Other measures related specifically to pedestrian flow include the ability to cross a pedestrian traffic stream, to walk in the reverse direction of a major pedestrian flow, to manoeuvre generally without conflicts and changes in walking speed, and the delay experienced by pedestrians at signalized and unsignalized intersections. It is dissimilar to the vehicular flow in that pedestrian flow may be unidirectional, bidirectional, or multi-directional. Pedestrian do not always travel in clear ”lanes” although they may do sometimes under heavy flow.
The fundamental relationship between speed, density, and volume for pedestrian flow is analogous to vehicular flow. As volume and density increase, pedestrian speed declines. As density increases and pedestrian space decreases, the degree of mobility afforded to the individual pedestrian declines, as does the average speed of the pedestrian stream, it is shown in Fig. 1.
The relationship among density, speed, and flow for pedestrians is similar to that for vehicular traffic streams, and is expressed in equation.
 | (1) |
where, Qped= unit flow rate (p/min/m), Sped= pedestrian speed (m/min), and Dped= pedestrian density (p/m2). Pedestrian density is an awkward variable in that it has fractional values in pedestrian per square meter. This relationship often expressed in terms of Space module(M) which is the inverse of pedestrian density. The inverse of density is more practical unit for analyzing pedestrian facilities ,so expression becomes
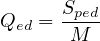 | (2) |
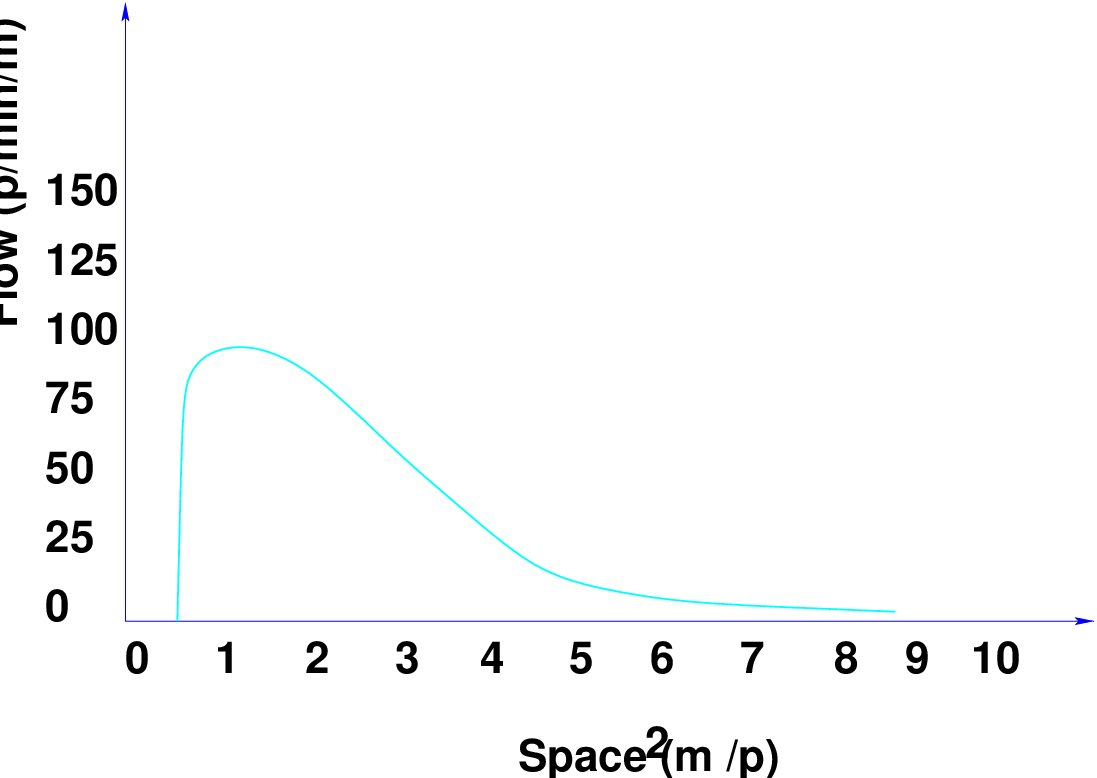
where M in(m2∕ped). The basic relationship between flow and space, recorded by several researchers, is illustrated in the Fig. 2.
The conditions at maximum flow represent the capacity of the walkway facility. From Fig. 2, it is apparent that all observations of maximum unit flow fall within a narrow range of density, with the average space per pedestrian varying between 0.4 and 0.9 m2/p. Even the outer range of these observations indicates that maximum flow occurs at this density, although the actual flow in this study is considerably higher than in the others. As space is reduced to less than 0.4 m2/p, the flow rate declines precipitously. All movement effectively stops at the minimum space allocation of 0.2 to 0.3 m2/p.
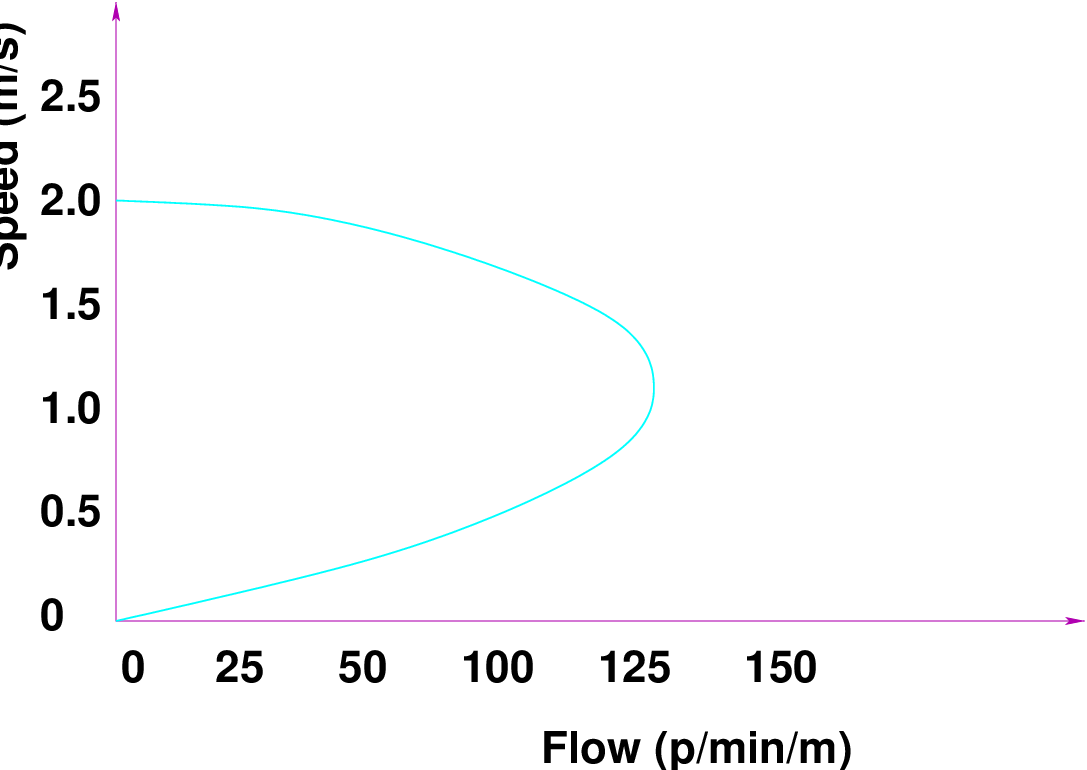
The following Fig. 3 illustrates the relationship between pedestrian speed and flow. These curves, similar to vehicle flow curves, show that when there are few pedestrians on a walkway (i.e., low flow levels), there is space available to choose higher walking speeds. As flow increases, speeds decline because of closer interactions among pedestrians. When a critical level of crowding occurs, movement becomes more difficult, and both flow and speed decline.
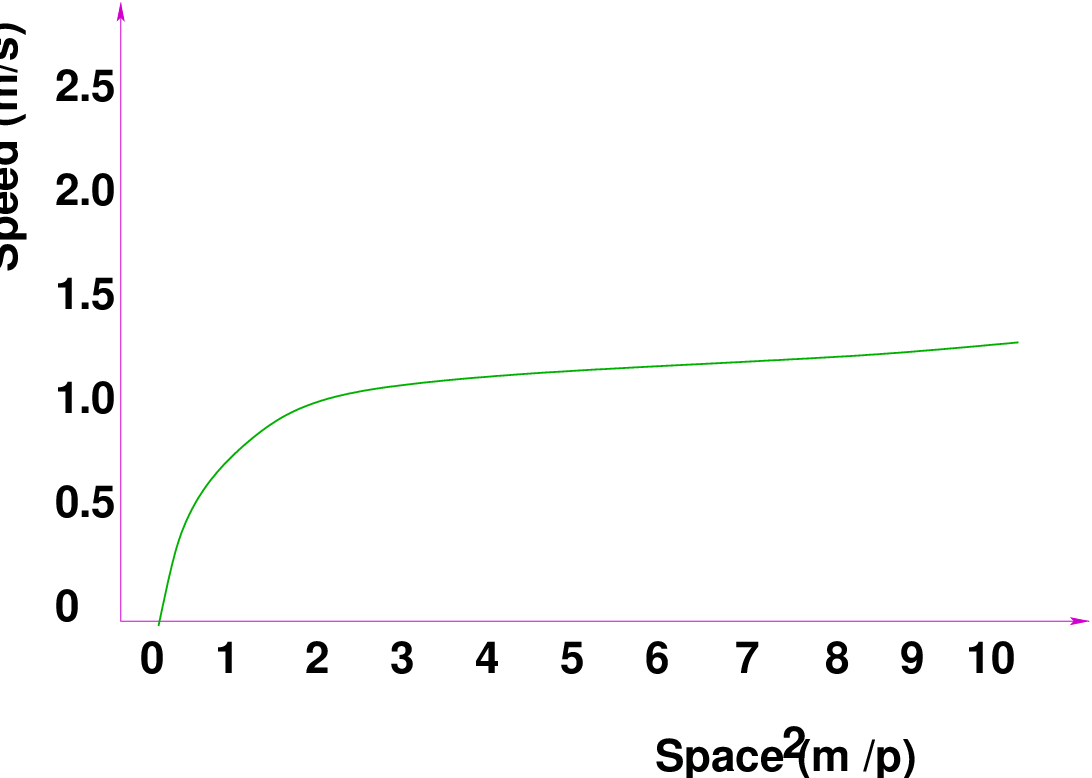
The Fig. 4 confirms the relationships of walking speed and available space, and suggests some points of demarcation for developing LOS criteria. The outer range of observations indicates that at an average space of less than 1.5 m2/p, even the slowest pedestrians cannot achieve their desired walking speeds. Faster pedestrians, who walk at speeds of up to 1.8 m/s, are not able to achieve that speed unless average space is 4.0 m2/p or more.
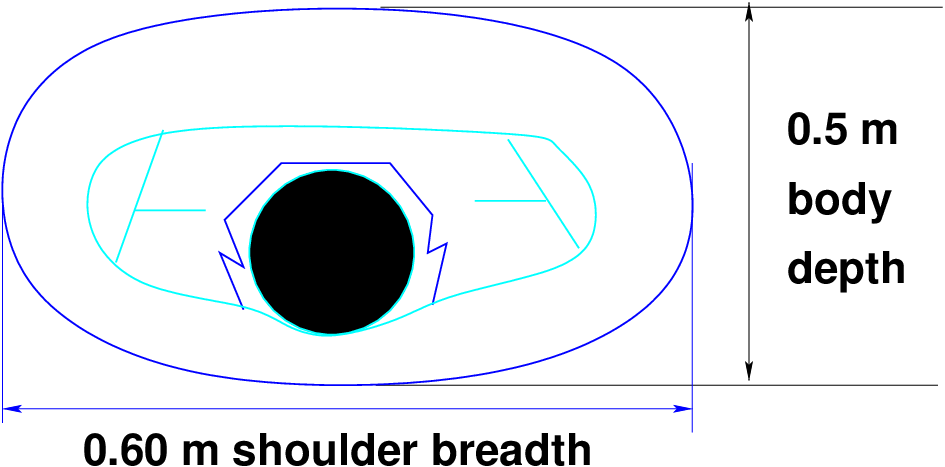
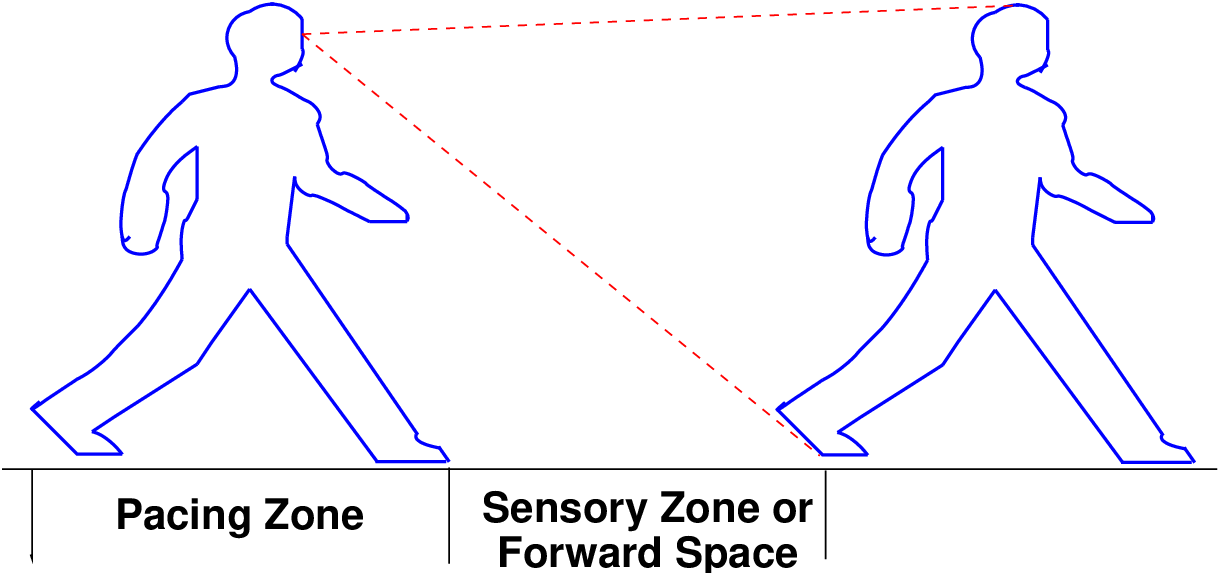
Pedestrian facility designers use body depth and shoulder breadth for minimum space standards, at least implicitly. A simplified body ellipse of 0.50 m * 0.60 m, with total area of 0.30 m2 is used as the basic space for a single pedestrian, as shown in Fig. 5 this represents the practical minimum for standing pedestrians. In evaluating a pedestrian facility, an area of 0.75 m2 is used as the buffer zone for each pedestrian. A walking pedestrian requires a certain amount of forward space. This forward space is a critical dimension, since it determines the speed of the trip and the number of pedestrians that are able to pass a point in a given time period. The forward space in the Fig 6 is categorized into a pacing zone and a sensory zone.
Pedestrian walking speed is highly dependent on the proportion of elderly pedestrians (65 years old or more) in the walking population. If 0 to 20 per cent of pedestrians are elderly, the average walking speed is 1.2 m/s on walkways. If elderly people constitute more than 20 per cent of the total pedestrians, the average walking speed decreases to 1.0 m/s. In addition, a walkway upgrade of 10 per cent or more reduces walking speed by 0.1 m/s. On sidewalks, the free-flow speed of pedestrians is approximately 1.5 m/s. There are several other conditions that could reduce average pedestrian speed, such as a high percentage of slow-walking children in the pedestrian flow.
A pedestrian start-up time of 3 s is a reasonable midrange value for evaluating crosswalks at traffic signals. A capacity of 75p/min/m or 4,500p/h/m is a reasonable value for a pedestrian facility if local data are not available. At capacity, a walking speed of 0.8 m/s is considered a reasonable value.
The HCM uses pedestrian space as primary measure of effectiveness, with mean speed and flow rate as secondary measures. Provision of adequate space for both moving and queuing pedestrian flow is necessary to ensure a good LOS. Alternatively LOS considered as pedestrian comfort, convenience, perception of safety and security. Alternative LOS measurements consider specific constraints to pedestrian flow such as stairway and wait time to cross roadways. We are going to discuss LOS of walkways, LOS of queuing and LOS at signalized intersection below.
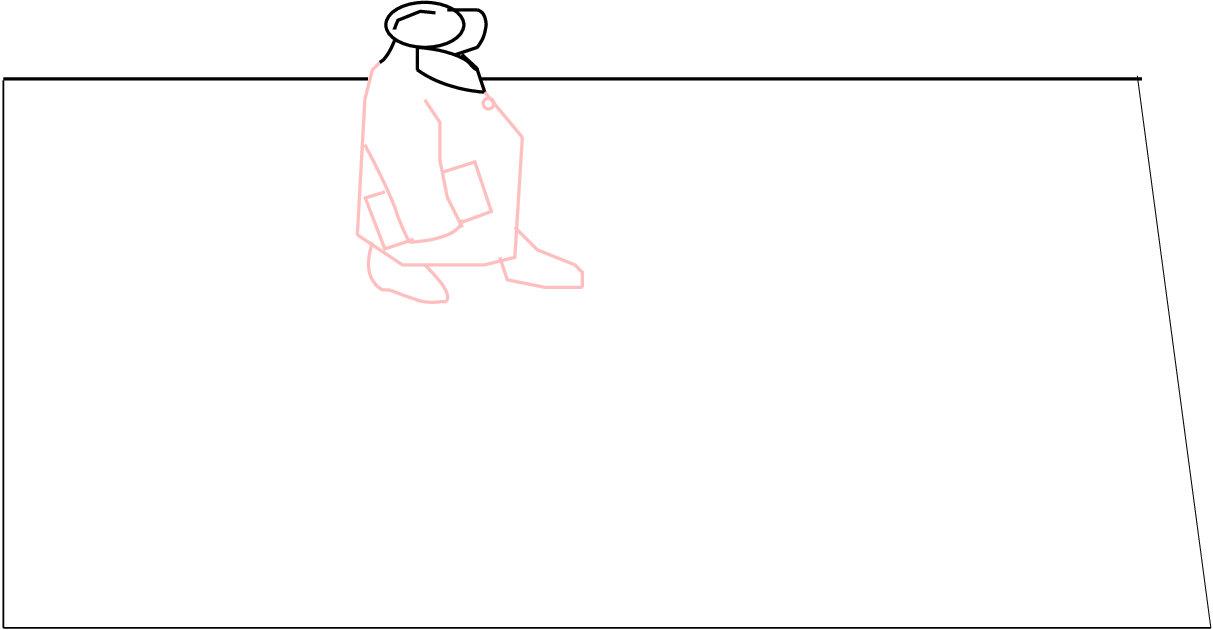
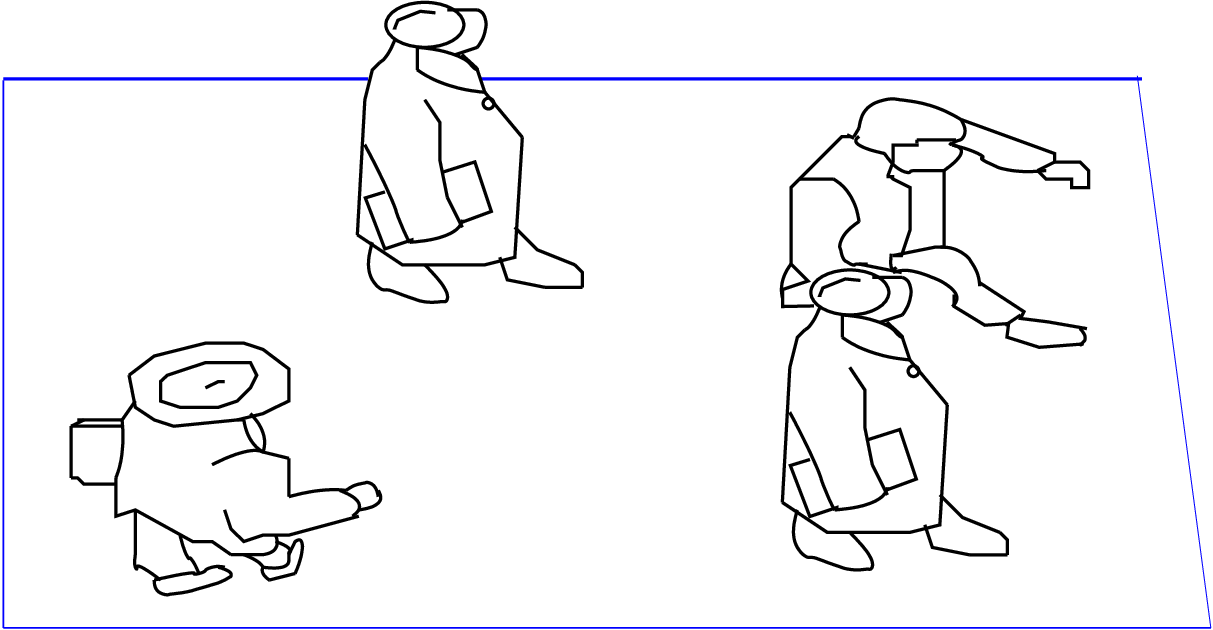
Pedestrian Space > 5.6 m2/p Flow Rate ≤ 16 p/min/m. At a walkway LOS A, pedestrians move in desired paths without altering their movements in response to other pedestrians. Walking speeds are freely selected, and conflicts between pedestrians are unlikely. It is shown in Fig. 7.
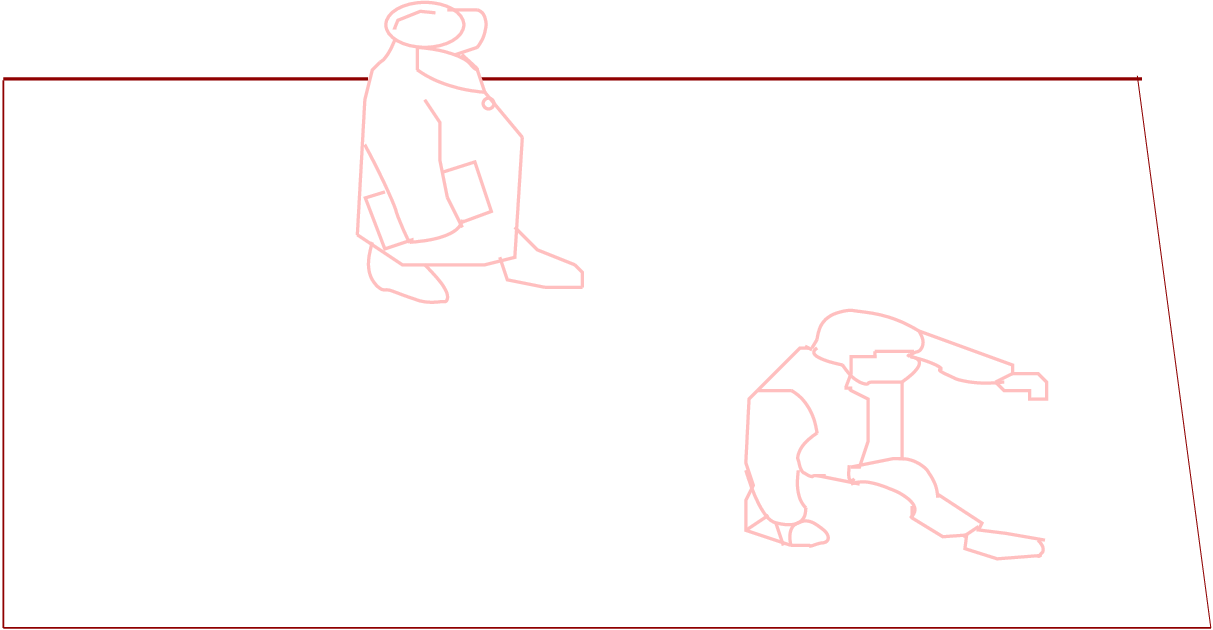
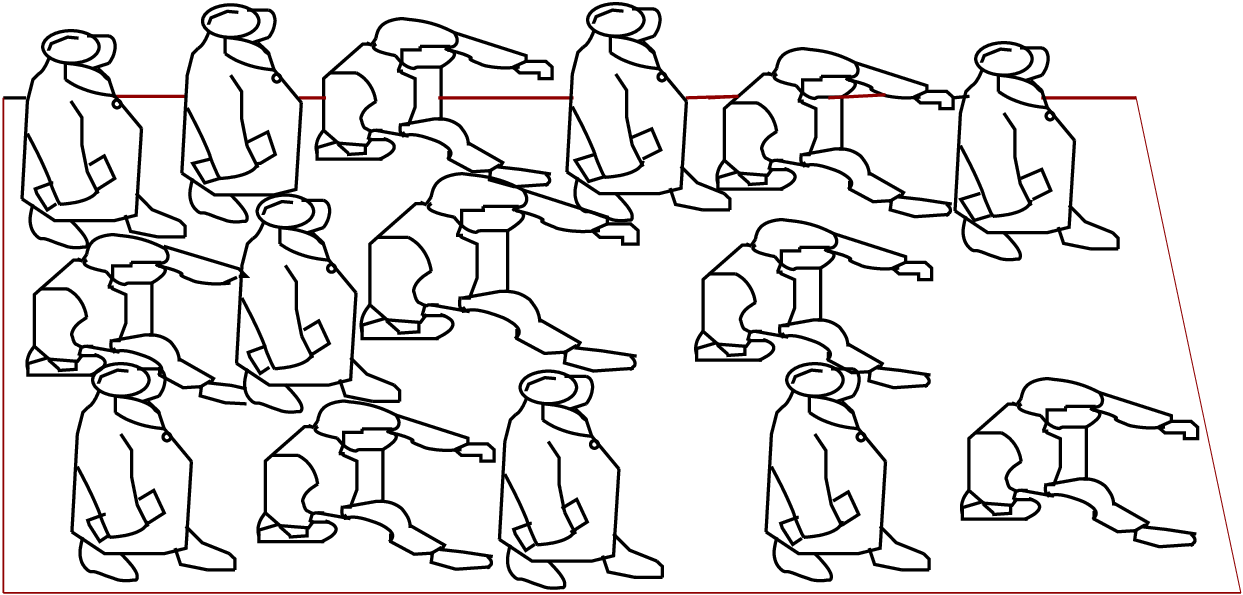
Pedestrian Space > 3.7 - 5.6 m2/p Flow Rate > 16 - 23 p/min/m. At LOS B, there is sufficient area for pedestrians to select walking speeds freely, to bypass other pedestrians, and to avoid crossing conflicts. At this level, pedestrians begin to be aware of other pedestrians, and to respond to their presence when selecting a walking path. It is shown in Fig. 8.
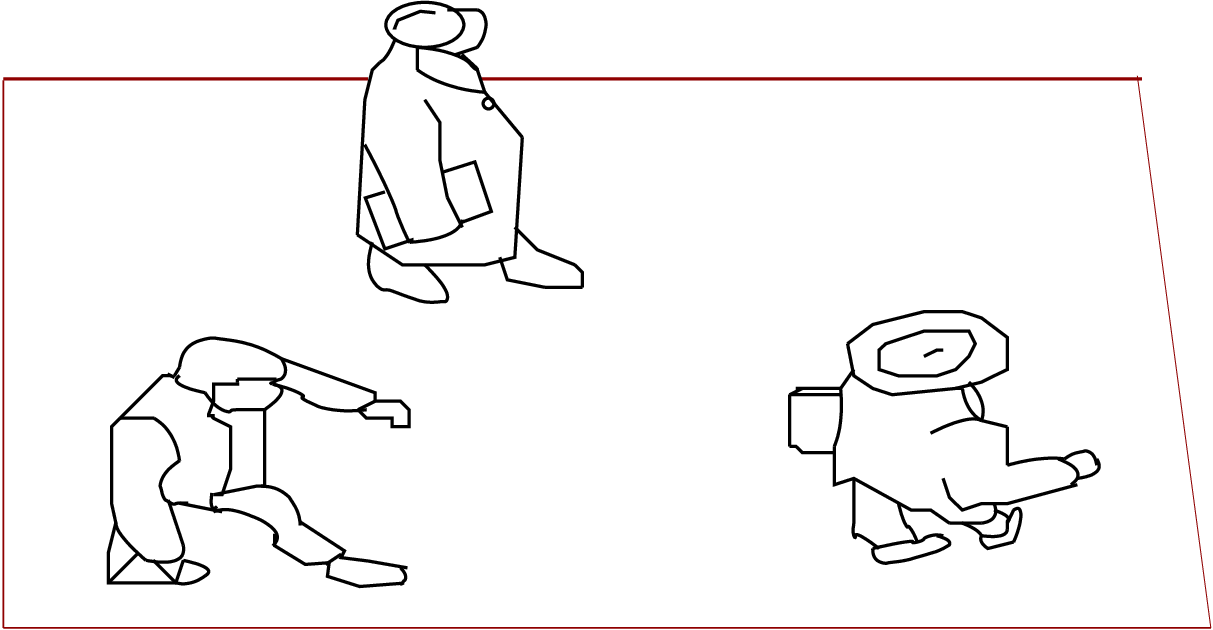
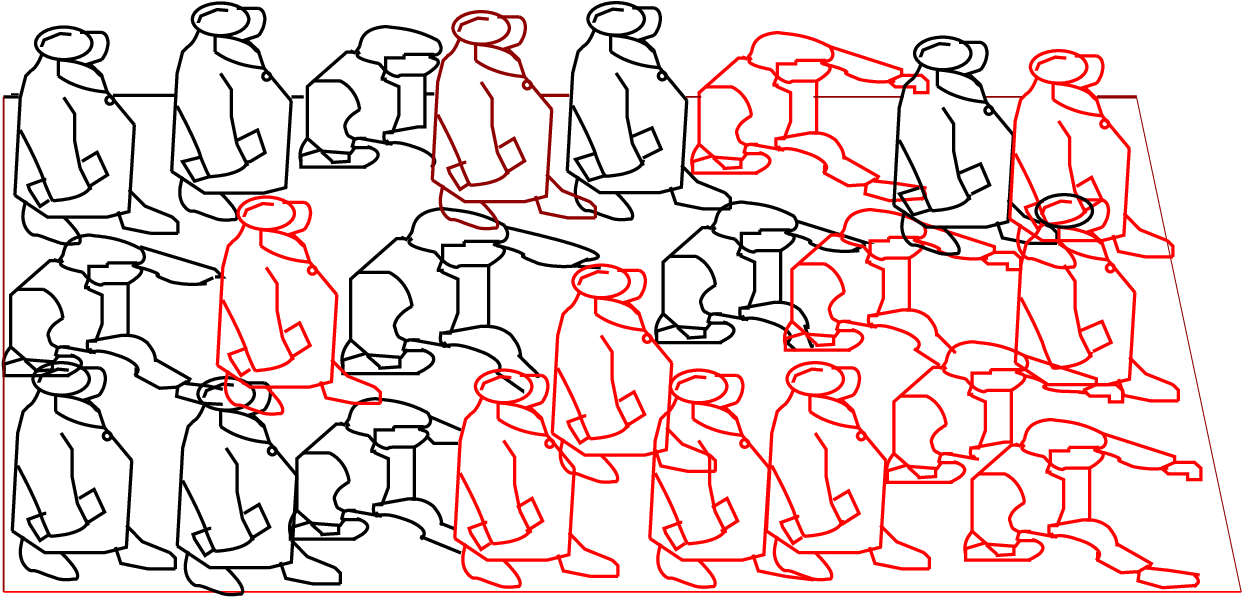
Pedestrian Space > 2.2 - 3.7 m2/p Flow Rate > 23 - 33 p/min/m. At LOS C, space is sufficient for normal walking speeds, and for bypassing other pedestrians in primarily unidirectional streams. Reverse-direction or crossing movements can cause minor conflicts, and speeds and flow rate are somewhat lower. It is shown in Fig. 9.
Pedestrian Space > 1.4 - 2.2 m2/p Flow Rate > 33 - 49 p/min/m. At LOS D, freedom to select individual walking speed and to bypass other pedestrians is restricted. Crossing or reverse flow movements face a high probability of conflict, requiring frequent changes in speed and position. The LOS provides reasonably fluid flow, but friction and interaction between pedestrians is likely. It is shown in Fig. 10.
Pedestrian Space > 0.75 - 1.4 m2/p Flow Rate > 49 - 75 p/min/m. At LOS E, virtually all pedestrians restrict their normal walking speed, frequently adjusting their gait. At the lower range, forward movement is possible only by shuffling. Space is not sufficient for passing slower pedestrians. Cross- or reverse-flow movements are possible only with extreme difficulties. Design volumes approach the limit of walkway capacity, with stoppages and interruptions to flow. It is shown in Fig. 11.
Pedestrian Space ≤ 0.75 m2/p Flow Rate varies p/min/m. At LOS F, all walking speeds are severely restricted, and forward progress is made only by shuffling. There is frequent, unavoidable contact with other pedestrians. Cross- and reverse-flow movements are virtually impossible. Flow is sporadic and unstable. Space is more characteristic of queued pedestrians than of moving pedestrian streams. It is shown in Fig. 12.
Average Pedestrian Space > 1.2 m2/p. Standing and free circulation through the queuing area is possible without disturbing others within the queue.
Average Pedestrian Space > 0.9 - 1.2 m2/ p. Standing and partially restricted circulation to avoid disturbing others in the queue is possible.
Average Pedestrian Space > 0.6 - 0.9 m2/p. Standing and restricted circulation through the queuing area by disturbing others in the queue is possible; this density is within the range of personal comfort.
Average Pedestrian Space > 0.3 - 0.6 m2/p. Standing without touching is possible; circulation is severely restricted within the queue and forward movement is only possible as a group; long-term waiting at this density is uncomfortable.
Average Pedestrian Space > 0.2 - 0.3 m2/p. Standing in physical contact with others is unavoidable; circulation in the queue is not possible; queuing can only be sustained for a short period without serious discomfort.
Average Pedestrian Space ≤ 0.2 m2/p. Virtually all persons within the queue are standing in direct physical contact with others; this density is extremely uncomfortable; no movement is possible in the queue; there is potential for panic in large crowds at this density.
The signalized intersection crossing is more complicated to analyze than a mid-block crossing, because it involves intersecting sidewalk flows, pedestrians crossing the street, and others queued waiting for the signal to change. The service measure is the average delay experienced by a pedestrian. Research indicates that the average delay of pedestrians at signalized intersection crossings is not constrained by capacity, even when pedestrian flow rates reach 5,000 p/h. The average delay per pedestrian for a crosswalk is given by Equation:
 | (3) |
Where, dp= average pedestrian delay (s), g = effective green time (for pedestrians) (s), and C= cycle length (s).
| LOS | Pedestrian Delay(s/p) | Likelihood of |
| Noncompliance | ||
| A | < 10 | Low |
| B | ≥ 10 - 20 | |
| C | > 20 - 30 | Moderate |
| D | > 30 - 40 | |
| E | > 40 - 60 | High |
| F | > 60 | Very high |
Calculate time delay of pedestrian crossing at a signalized intersection operating on a two phase, 80.0-s cycle length, with 4.0-s change interval, and no pedestrian signals. Major street: Phase green time, Gd = 44.0 s; Crosswalk length, Ld = 14.0 m; Minor street: Crosswalk length, Lc = 8.5 m; Phase green time, Gc = 28.0 s;
Solution dp =(c-g)2/2c, dp (major) = (80.0 - 28.0)* (80.0 - 28.0)/2(80), = 16.9 s (i.e. LOS B using above table), dp (minor) = (80.0 - 44.0)* (80.0 - 44.0)/2(80) = 8.1 s (i.e. LOS A using above table).
In the design facilities we will discuss the design criteria of sidewalk, street corner, crosswalk, traffic island, overpass and underpass and other facilities like as pedestrian signals and signage.
Sidewalks are pedestrian lanes that provide people with space to travel within the public right-of-way that is separated from roadway vehicles. They also provide places for children to walk, run, skate, ride bikes, and play. Sidewalks are associated with significant reductions in pedestrian collisions with motor vehicles.
| Pedestrian Flow rate | LOS A | LOS B | LOS C | LOS D | LOS E |
| (pedestrian/hour) | |||||
| < 600 | 1.5 m | 1.2 m | 1.2 m | 1.2 m | 1.2 m |
| 600-1200 | 3.1 m | 1.2 m | 1.2 m | 1.2 m | 1.2 m |
| 1200-2400 | 6.1m | 1.8 m | 1.5 m | 1.2 m | 1.2 m |
| 2400-3600 | 2.8 m | 1.8 m | 1.5 m | 1.2 m | |
| 3600-4800 | 3.7 m | 2.5 m | 1.8 m | 1.2 m | |
| 4800-6000 | 4.6 m | 3.1 m | 2.1 m | 1.2 m | |
| 6000-7200 | Not | 5.5 m | 3.7 m | 2.5 m | 1.5 m |
| 7200-8400 | recommended | 6.1 m | 4.3 m | 3.1 m | 1.8 m |
| 8400-9600 | 7.1 m | 4.9 m | 3.4 m | 2.1 m | |
| 9600-10800 | 8.1 m | 5.5 m | 3.7 m | 2.5 m | |
| 10800-12000 | 8.9 m | 6.1 m | 4.3 m | 2.5 m | |
A buffer zone of 1.2 to 1.8 m (4 to 6 ft) is desirable and should be provided to separate pedestrians from the street. The buffer zone will vary according to the street type. In downtown or commercial districts, a street furniture zone is usually appropriate.
Marked crosswalks indicate optimal or preferred locations for pedestrians to cross and help designate right-of-way for motorists to yield to pedestrians. Crosswalks are often installed at signalized intersections and other selected locations.
Traffic islands to reduce the length of the crossing should be considered for the safety of all road users. It is used to permit safe crossing when insufficient gap in two directions traffic & helps elderly, children and disabled.
Pedestrian facilities at-grade and as directly as possible are always preferred. However, where grade separation is indicated, paths that are attractive, convenient and direct can become well-used and highly valued parts of a city’s pedestrian infrastructure.
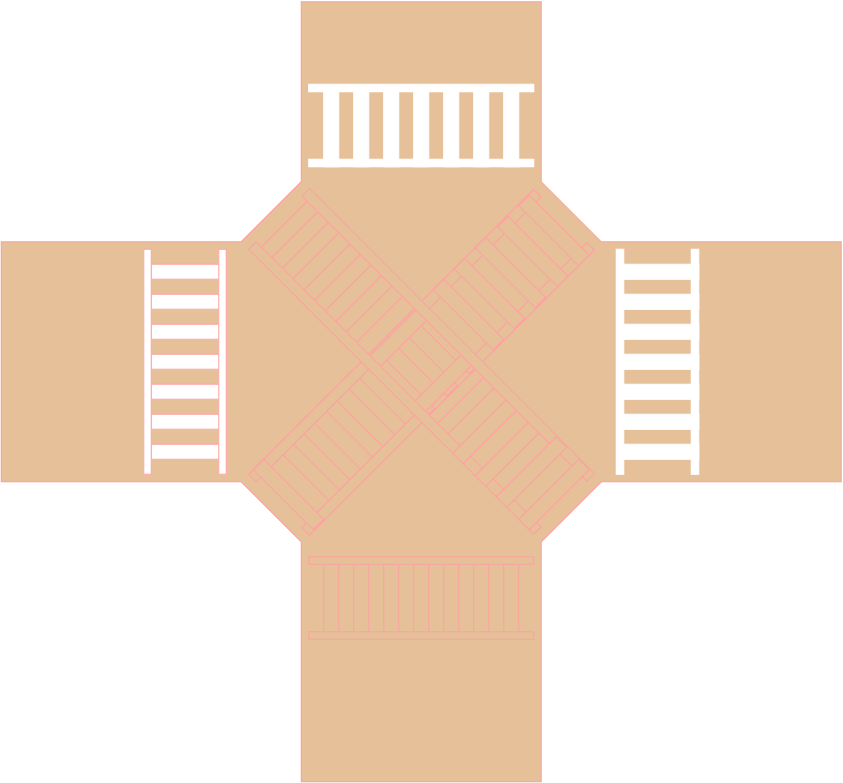
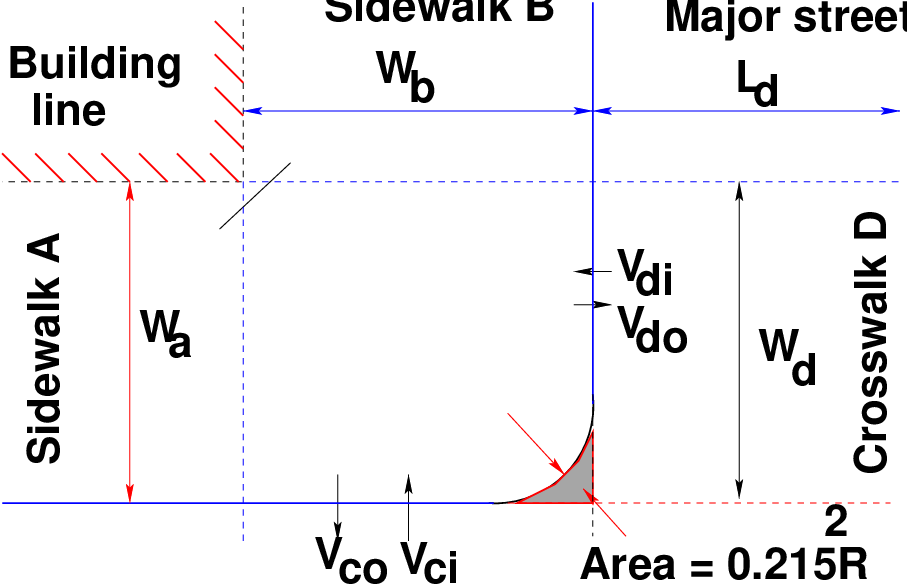
Available Time-Space: The total time-space available for circulation and queuing in the intersection corner during an analysis period is the product of the net corner area and the length of the analysis period. For street corners, the analysis period is one signal cycle and therefore is equal to the cycle length. The following equation is used to compute time-space available at an intersection corner. Intersection Corner Geometry is shown in Fig. 15.
 | (4) |
where, TS =available time-space (m2-s), Wa = effective width of Sidewalk a (m), Wb = effective width of Sidewalk b (m), R = radius of corner curb (m), and C = cycle length (s).
Pedestrian signals are designed basically considering minimum time gap required for crossing the pedestrians. This minimum time gap can be calculated by using following gap equation.
 | (5) |
where, Gs=min time gap in sec, W= width of crossing section, ts= startup time, tc=consecutive time between two pedestrian, N=no of rows, and Sped =pedestrian speed.
Calculate time gap for a platoon of 27 school children 5 in a row, consecutive time 2 sec width of crossing section is 7.5 m and walking speed of children .9 m/s start up time 3 sec. Solution Given w=7.5m; tc= 3 sec Sped= 0.9m/s Find out N N=27/5 i.e. 6 row (5 containing 5 & 6th containing 2) Time gap
![Gs = -W--+ tc(N - 1)+ ts
Sped
= [(7.5∕0.9)+ 2(6 - 1)+ 3]
= 21.33sec](web5x.png)
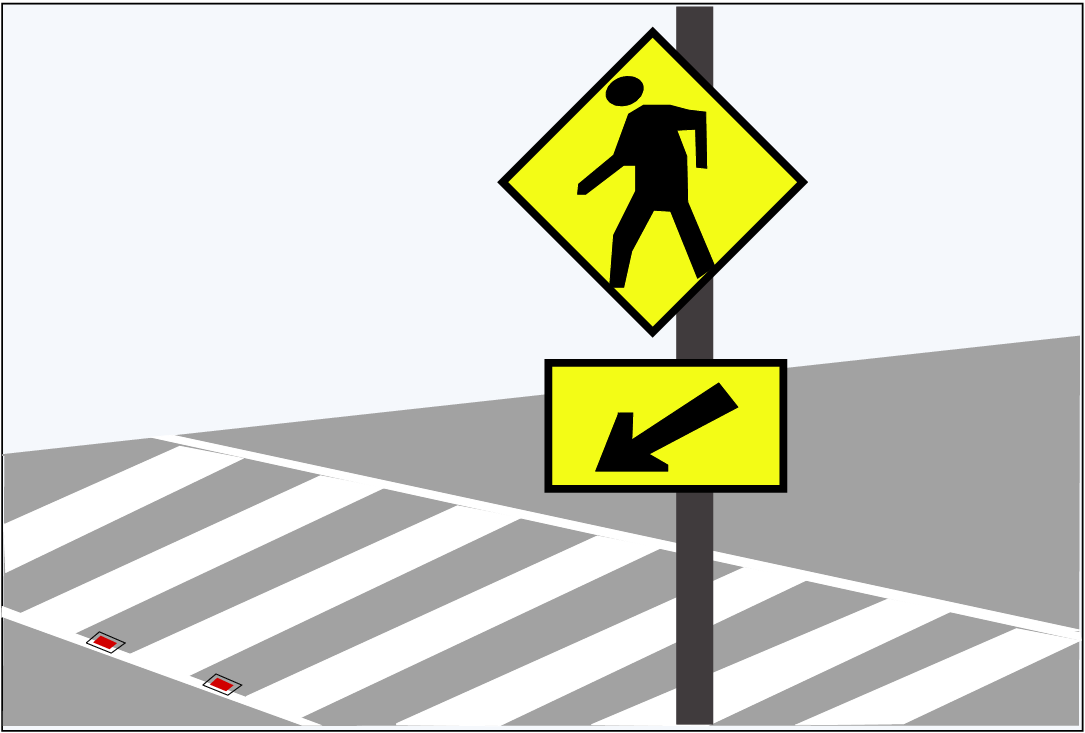
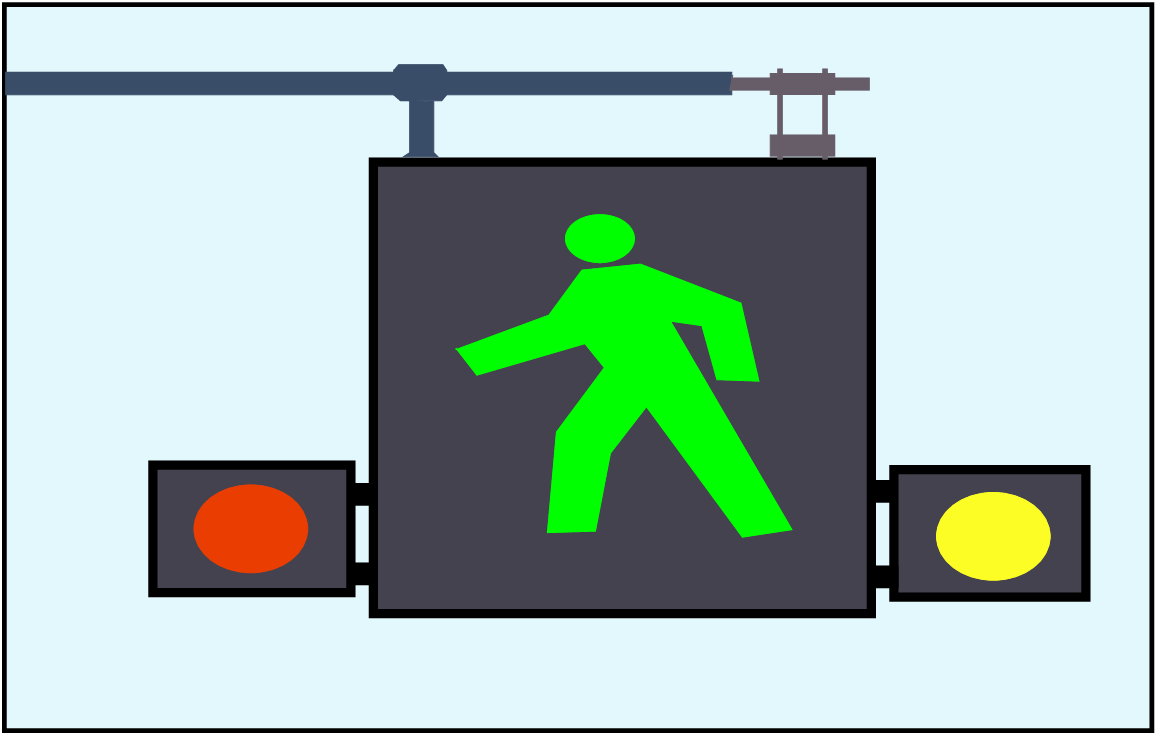
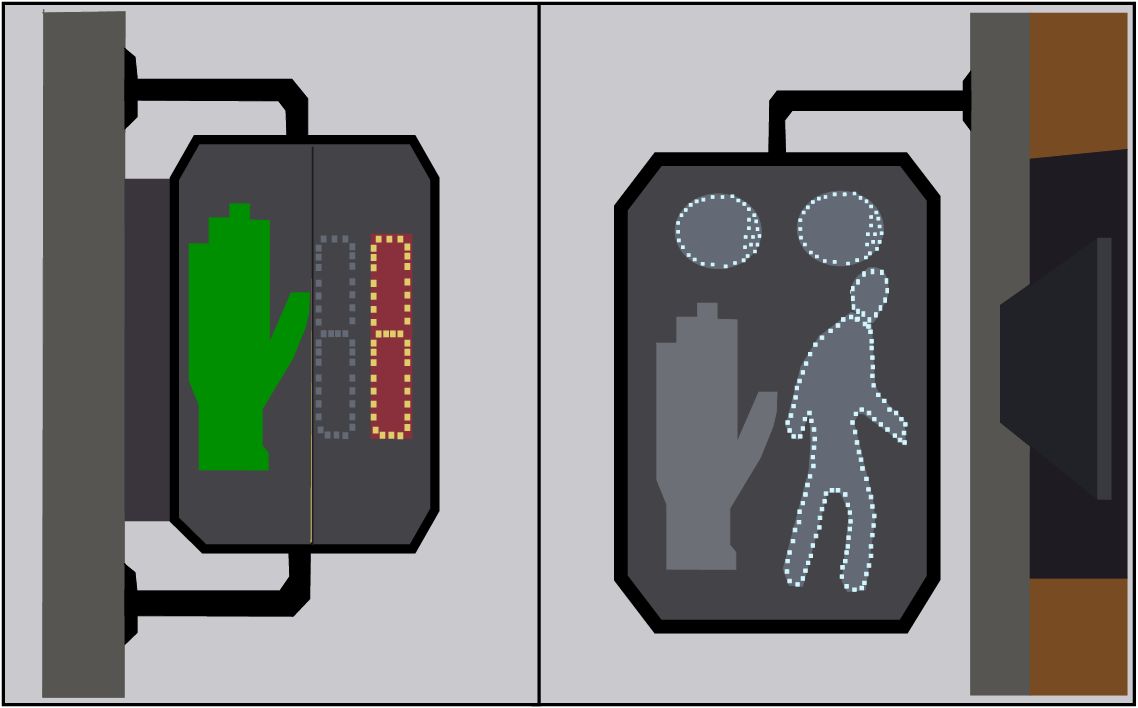
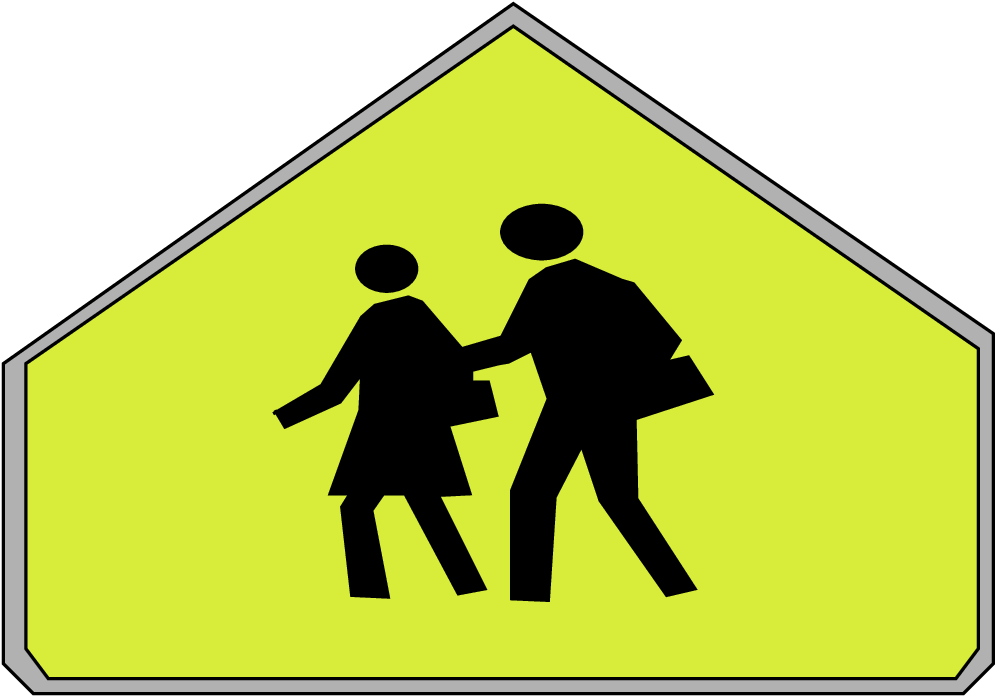
There are many signage used for pedestrian facilities like as in-pavement flashers, overhead signs, animated pedestrian indications and school zone symbol. These are shown below.
This lectures covers pedestrian problems, their characteristics, different level of services and design principles of pedestrian facilities. Pedestrian as the most basic unit / component for street and public space design. Pedestrian includes vulnerable road users - elderly, disabled, children, people with luggage etc. Safety of pedestrians to be on top priority (to be never compromised by design / policy). Effective integration of technical innovations, policies, institutional mechanisms for pedestrian safety.
I wish to thank several of my students and staff of NPTEL for their contribution in this lecture. Specially, I wish to thank my student Mr. Anuj Yadav for his assistance in developing the lecture note, and my staff Mr. Rayan and Ms. Reeba in typesetting the materials. I also appreciate your constructive feedback which may be sent to tvm@civil.iitb.ac.in
Prof. Tom V. Mathew
Department of Civil Engineering
Indian Institute of Technology Bombay, India
_________________________________________________________________________
Thursday 28 September 2023 11:40:45 AM IST