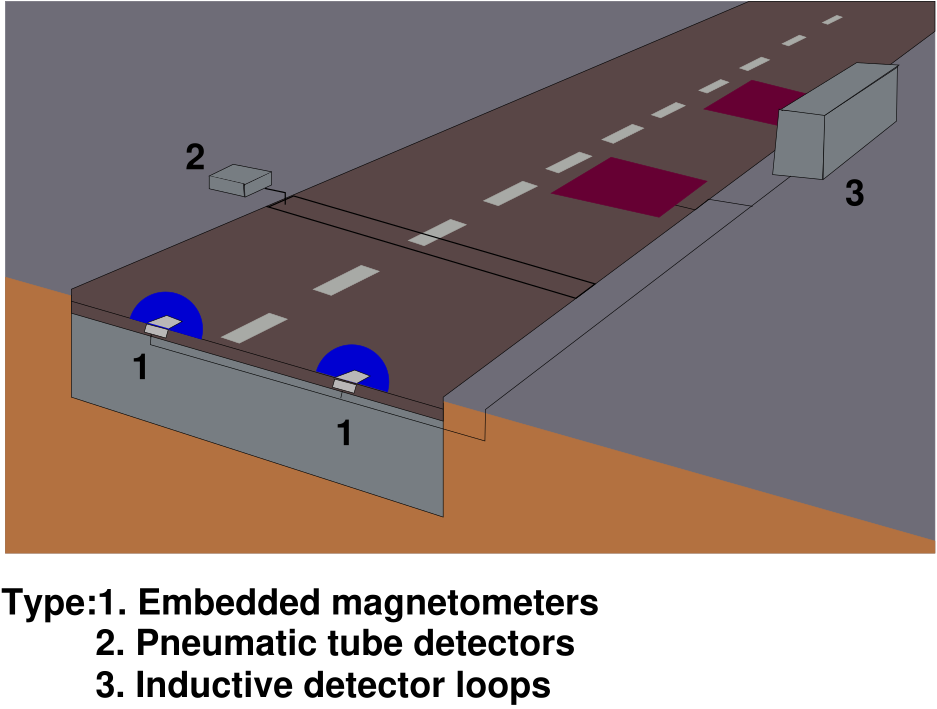
Typical examples of intrusive technologies, their sensor types and installation locations are shown in
Fig. 1. The first types of units (Fig. 1, Type 1) are passive magnetic or magneto-meter sensors that are
either permanently mounted within holes in the road, or affixed to the road surface in some fashion. The
unit communicates to a nearby base station processing unit using either wires buried in the road, or
wireless communications. The sensor has a circular or elliptically offset zone of detection (i.e., the blue
area).
The second types of units (Fig. 1, Type 2) use pneumatic tubes that are stretched across the
carriageway and affixed at the kerb side at both ends. Such systems are only be deployed on a temporary
basis, due to the fragile nature of tubes, which are easily damaged or torn up by heavy or fast moving
vehicles.
The third type (Fig. 1, Type 3) are inductive detector loops (IDL), consisting of coated wire coils buried
in grooves cut in the road surface, sealed over with bituminous filler. A cable buried with the loop sends
data to a roadside processing unit. The zone of detection for inductive loop sensors depends on the cut
shape of the loop slots. The zones depending on the overall sensitivity of system not correspond precisely
to the slot dimensions. IDLs are a cheap and mature technology. They are installed on both major
roads and within urban areas, forming the backbone detector network for most traffic control
systems.
The fourth type of intrusive system is Weigh-In-Motion (WIM) shown in Fig. 2, detectors that consist of
a piezoelectric sensor (e.g. ‘bending-plate’ or fiber-optic) system laid in a channel across the road. These
systems are relatively rare and are used in specific locations for enforcement or access control. They are
usually coupled with other systems, either intrusive or non-intrusive, to provide additional cross-checks on
collected data.
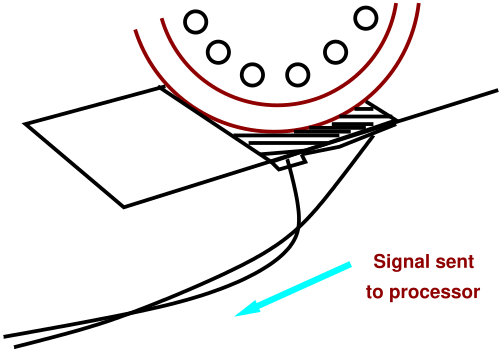
Pneumatic road tube sensors send a burst of air pressure along a rubber tube when a vehicles tire
passes over the tube. The pulse of air pressure closes an air switch, producing an electrical
signal that is transmitted to a counter or analysis software. The pneumatic road tube sensor is
portable, using lead-acid, gel, or other rechargeable batteries as a power source. The road tube is
installed perpendicular to the traffic flow direction and is commonly used for short-term traffic
counting, vehicle classification by axle count and spacing. Some data to calculate vehicle gaps,
intersection stop delay, stop sign delay, and saturation flow rate, spot speed as a function of vehicle
class, and travel time when the counter is utilized in conjunction with a vehicle transmission
sensor.
Advantages
Disadvantages
Oscillating electrical signal is applied to the loop. The metal content of a moving vehicle chassis changes
the electrical properties of circuit. Changes are detected at a roadside unit, triggering a vehicle event. A
single loop system collects flow and occupancy. The speed can be calculated by the assumptions that are
made for the mean length of vehicles. Two-loop systems collect flow, occupancy, vehicle length, and
speed.
Advantages
Disadvantages
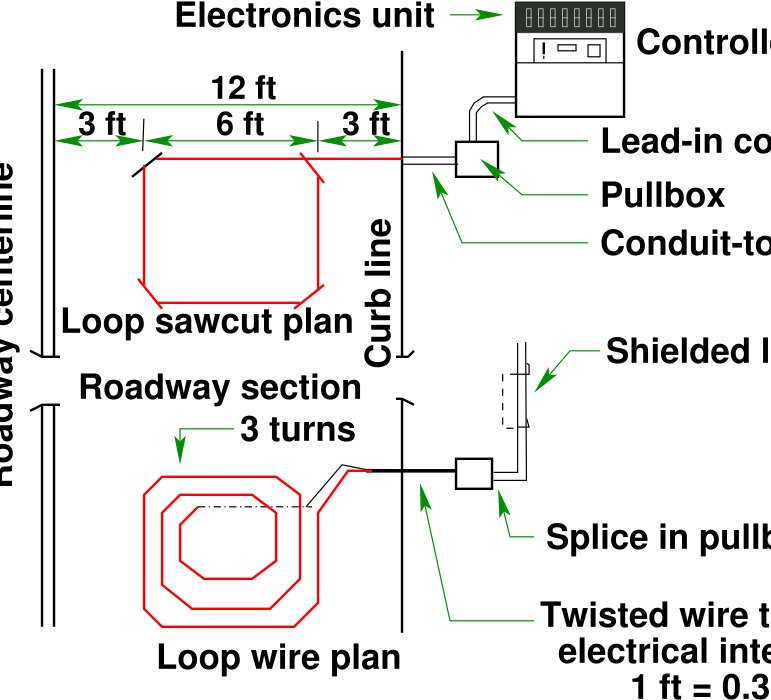
A typical single loop system is shown in Fig. 3. The system consists of three components: a detector oscillator, a lead-in cable and a loop embedded in the pavement. The size and shape of loops largely depend on the specific application. The most common loop size is 1.83 m by 1.83 m and shape is hexagonal as single turn or two or three turns as shown in Fig. 3. When a vehicle stops or passes over the loop, the inductance of the loop is decreased.The decreased inductance then increases the oscillation frequency and causes the electronics unit to send a pulse to controller, indicating the presence or passage of a vehicle. Single loop detectors output predicts occupancy and traffic count data within specific time intervals like 20 sec, 30 sec.
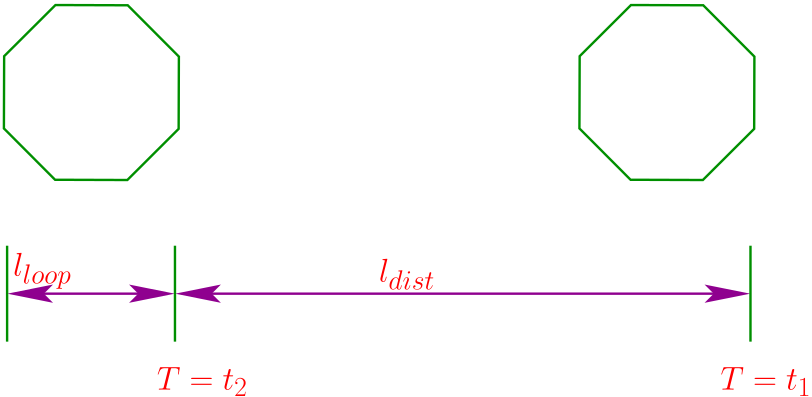
Dual-loop detectors are also called speed traps, T loops, or double loop detectors. In a dual-loop system,
two consecutive single inductance loops, called “M loop” and “S loop”, are embedded a few distance
apart as shown in Fig. 4. With such a design, when one of them detects a vehicle, timer is
automatically started in the dual-loop system and runs until the same vehicle is detected by other
loop.Thus, in addition to outputs of vehicle count and occupancy data, individual vehicle speeds
can be trapped through the dividend of the distance between those two single loops \(l_{dist}\) by the
elapsed time. Speed trap is defined as the measurement of the time that a vehicle requires to
travel between two detection points. Spot speed is measured by following Eqn. 1. \begin {equation} Speed = \frac {l_{dist}}{t_2 – t_1} \label {qeAutoSpotSpeed} \end {equation} where,
\(l_{dist}\) = Distance between two loops in meters
\(t_1\) = Vehicle entry time at first loop in sec
\(t_2\) = Vehicle entry time at second loop in sec
Dual-loop detectors can also be used to measure vehicle lengths with extra data extracted from
controllers’ records. The length of vehicle is measured by following Eqn. 2: \begin {equation} L_{vehicle} = \frac {Speed|ot_2 + 0t_1|}{2} \label {qeAutoVehicleLength} \end {equation} where,
\(L_{vehicle}\) = Length of vehicle in meters.
\(ot_i\) = on-time for loop detector i; Speed in m/sec
Example-1
If the vehicle entering the freeway in loop M at time 8:32:22:00 am and leaving loop N at time 8:32:22:15
am, the distance between two loops will be 3.66 m. Find the spot speed of the vehicle. Also
find the length of the vehicle if time occupancy for M - loop is 0.25sec and 0.29 for N - loop.
Solution:
Step 1 Spot Speed calculated from the equation 1, where given that the distance between
two loops are 3.66m and entry, exit times are 8:32:22:00 and 8:32:22:15 substitute in Eqn. 1.
\(SpotSpeed = (3.66)/(15 - 0)/100 = 24.4~\mathrm {m/sec}\).
Step 2 The vehicle length can obtained by the spot speed of the vehicle, so substitute the occupancy
times at exit and entry in the Eqn. 2.
\begin {equation} L_{vehicle} = \frac {(52.7/3.6)|0.25 + 0.29|}{2} = 3.95~\mathrm {m}. \end {equation}
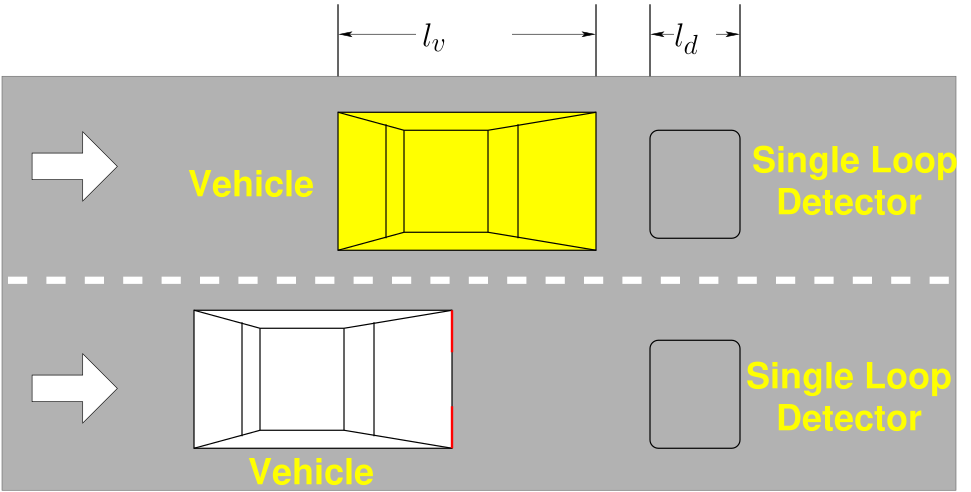
Fig. 5 shows a two-lane unidirectional roadway segment with single loop detectors installed.Assume that
the detection zone length is \(l_d\) and is equal to the detector length, the length of the vehicle is \(l_v\), the speed of
the vehicle is \(S\), then the actual time (the time period that the vehicle is over the detector) can be
calculated by: \begin {equation} S = \frac {EVL}{t_o} \end {equation} where,
\(S\) = Spot speed in m/sec
\(EVL\) =vehicle length \(l_v\) + detector length \(l_d\)
\(t_o\) = Occupancy time
There are many algorithms for estimating speed by single loop. The most common method is based on
the relationship between fundamental traffic variables. It uses a constant or a function to
convert loop occupancy into density. The variables include inductive loop length, average
vehicle length, occupancy, and traffic volume.For the given number of vehicle and duration of
the observed data the specimen speed can find by following Eqn. 5 is shown below. \begin {equation} s = \frac {N}{T \times O \times g} \label {qeAutoSpecimenSpeed} \end {equation} where,
\(S\) = Space mean speed in m/sec
\(N\) = Number of vehicles in the observed interval
\(T\) = Observation interval in sec
\(O\) = occupancy time
\(g\) = speed correction factor; (based upon assumed vehicle length, detector configuration, and traffic
conditions) Most of the algorithms followed as (40.9/6.55) for average vehicle length 6.55m.
Example-2
The length of vehicle is 4 m and the length of loop detector zone is 1.83 m. The time occupancy in the
loop is 0.3 sec, find the spot speed of the vehicle?
Solution:
From the given data the average vehicle length is 4 m and the length of loop detector zone is 1.833 m, the
time occupancy in loop is 0.3 sec substitute in Eqn. 1.
Example-3
In freeway 2500 vehicles are observed during 300 sec interval. The loop occupancy is 75 percentages and
the average length of vehicle observed as 6.55 m, find the space mean speed on the freeway section?
Solution
Given data is number of vehicle is 2500, duration is 300 sec, loop occupancy is 75 percentage, the
average length of vehicle is 6.55 so speed correction factor is 40.99/6.55 substitute in Eqn. 5.
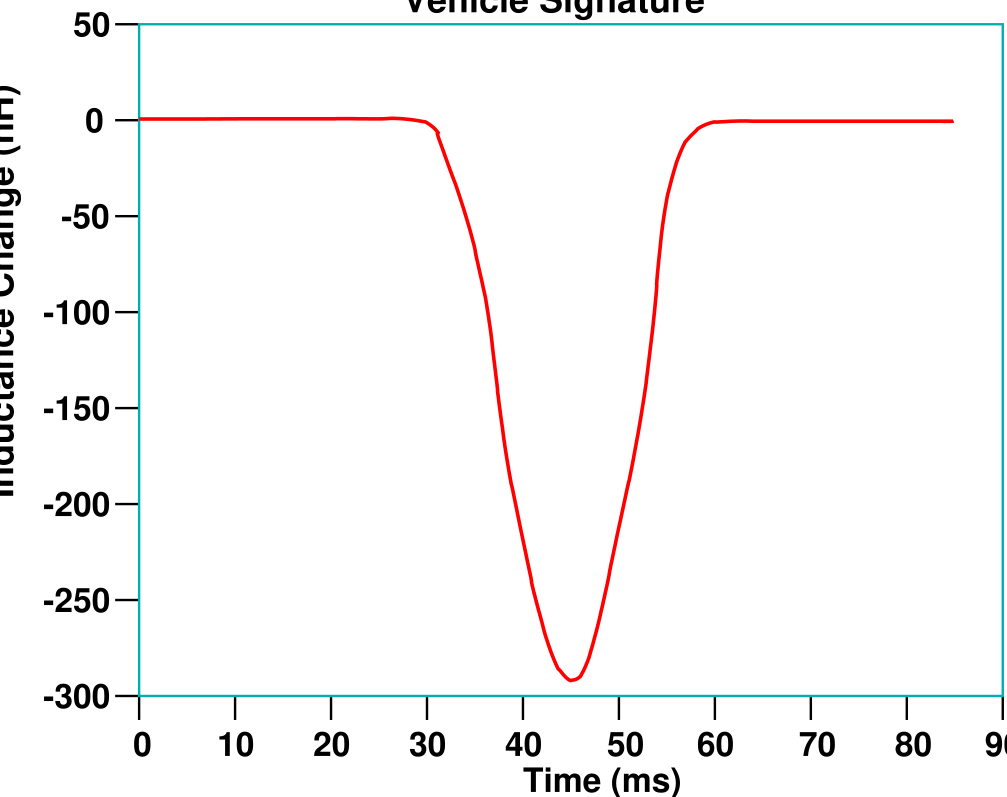
Loop detectors detect the frequency changes from zero to different level, the inductance changes are
computed by change in frequency. The change in inductance due to the presence of vehicle is recorded at a
small time interval. The waveform obtained by plotting the sampled inductance changes is referred to as
the vehicle inductive waveform or inductance signature.This waveform depends on number of vehicle
parameters such as vehicle length, speed, and metal surface of the vehicle. Fig. 6 shows an inductive
waveform of a typical passenger car.Horizontal axis records data points at 10 milliseconds interval. This is
the common shape of inductance waveform that has one peak in the middle with monotonic decrease in
both sides. Vehicle signatures are functions of vehicle speed and vehicle type, so many features can be
derived from the vehicle signatures directly or indirectly. Volume and occupancy are directly derived from
processing raw vehicle signatures whereas speed is estimated based on the vehicle signature feature
vectors. Vehicle length is obtained based on vehicle speed. By combining vehicle length with
existing vehicle signature features, vehicle classification can be measured. It is easy to observe
signature differences arising from the vehicle speed. Duration or occupancy has an inverse
proportional relationship with speed while slew rate shows a proportional correspondence with speed.
A series of vehicle signature acquired by the Inductive Loop Detectors located at upstream and downstream of a freeway and different distance measures to find the re identification accuracy level. Double-axle trucks produce a double picked vehicle signature when the resolution of detector is adequate. Thus, it can be easily used for vehicle-type identification purposes.
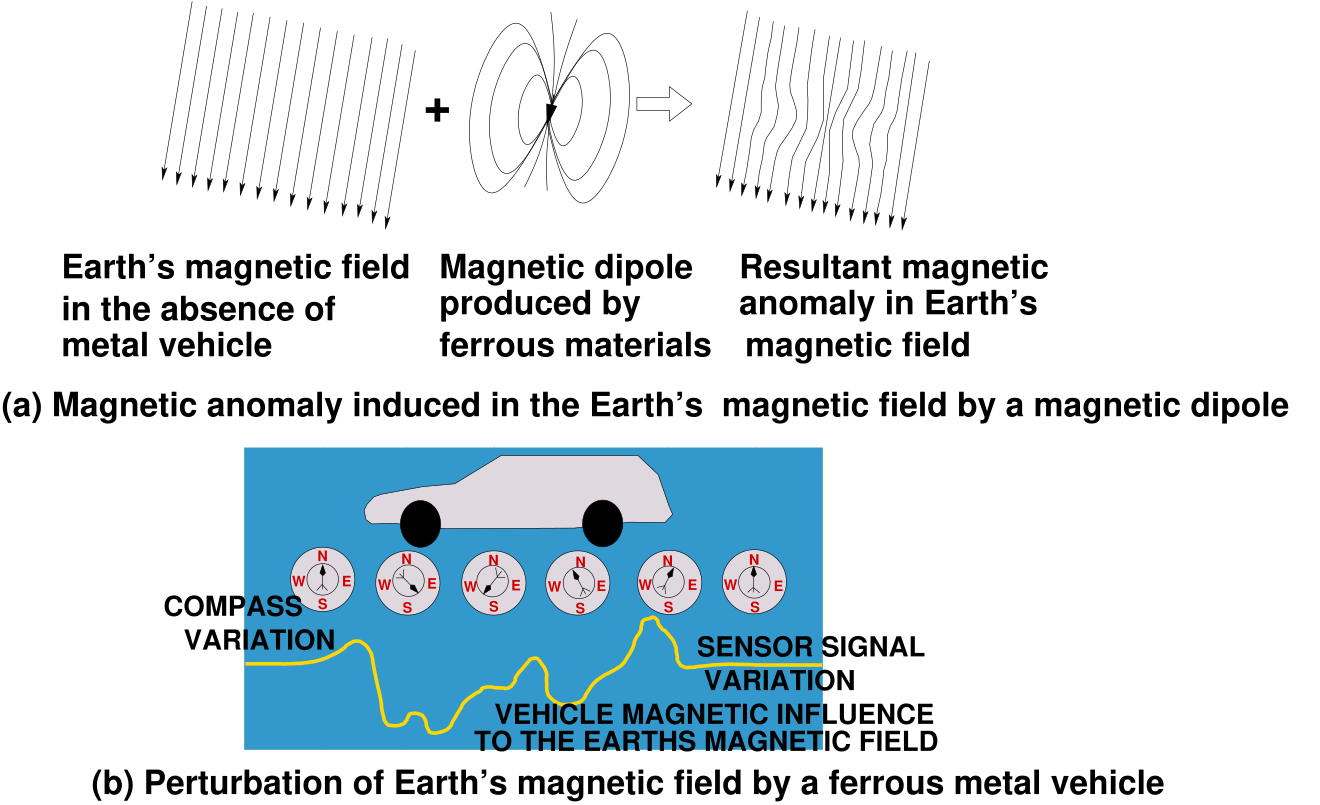
Magneto-meters monitor for fluctuations in the relative strength of the Earth’s magnetic field, which is
changed by the presence of a moving metal object i.e., a vehicle. A single passive magnetic system collects
flow and occupancy. Two magneto-meter systems collect flow, occupancy, vehicle length, and
speed.
Two types of magnetic field sensors are used for traffic flow parameter measurement. The
first type, the two-axis flux-gate magneto-meter, detects changes in vertical and horizontal
components of the Earth s magnetic field produced by a ferrous metal vehicle. The two-axis
flux-gate magneto-meter contains a primary winding and two secondary sense winding on a
coil surrounding high permeability soft magnetic material core. The second type of magnetic
field sensor is the magnetic detector, more properly referred to as an induction or search coil
magneto-meter shown in Fig. 7. It detects the vehicle signature by measuring the change in the
magnetic lines of flux caused by the change in field values produced by a moving ferrous metal
vehicle. These devices contain a single coil winding around a permeable magnetic material rod
core. However, most magnetic detectors cannot detect stopped vehicles, since they require
a vehicle to be moving or otherwise changing its signature characteristics with respect to
time.
Advantages
Disadvantages
Bending plate WIM systems utilize plates with strain gauges bonded to the underside. The system records
the strain measured by strain gauges and calculates the dynamic load. Static load is estimated using the
measured dynamic load and calibration parameters. Calibration parameters account for factors, such as
vehicle speed and pavement or suspension dynamics that influence estimates of the static weight. The
accuracy of bending plate WIM systems can be expressed as a function of the vehicle speed traversed over
the plates, assuming the system is installed in a sound road structure and subject to normal traffic
conditions.
Advantages
Bending plate WIM systems is used for traffic data collection as well as for weight enforcement purposes.
The accuracy of these systems is higher than piezoelectric systems and their cost is lower than load
cell systems. Bending plate WIM systems do not require complete replacement of the sensor.
Disadvantages
Bending plate WIM systems are not as accurate as load cell systems and are considerably more expensive
than piezoelectric systems.
Piezoelectric WIM systems contain one or more piezoelectric sensors that detect a change in voltage
caused by pressure exerted on the sensor by an axle and thereby measure the axle s weight. As a vehicle
passes over the piezoelectric sensor, the system records the sensor output voltage and calculates the
dynamic load. With bending plate systems, the dynamic load provides an estimate of static load when the
WIM system is properly calibrated.
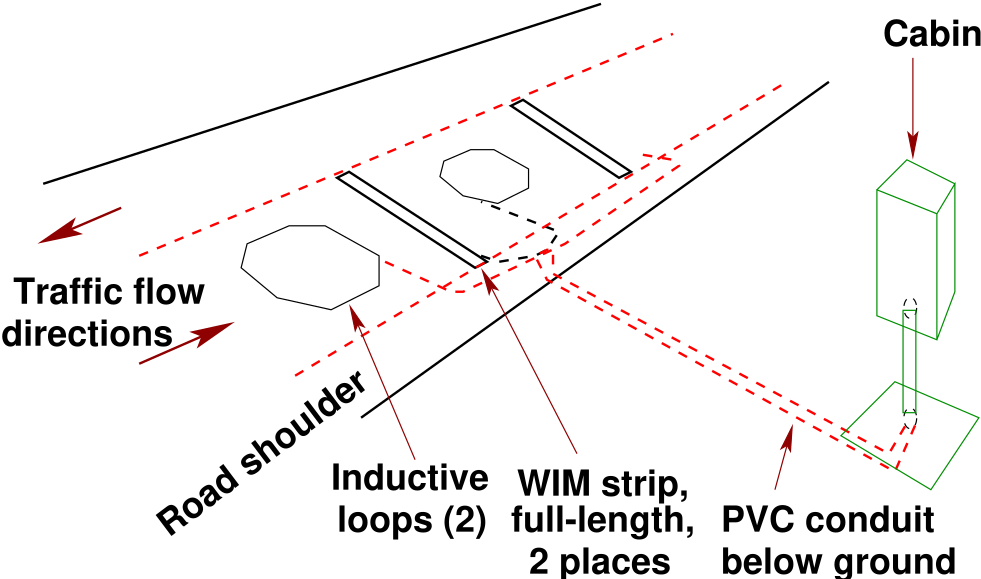
The typical piezoelectric WIM system consists of at least one piezoelectric sensor and two ILDs. The
piezoelectric sensor is placed in the travel lane perpendicular to the travel direction. The inductive
loops are placed upstream and downstream of the piezoelectric sensor. The upstream loop
detects vehicles and alerts the system to an approaching vehicle. The downstream loop provides
data to determine vehicle speed and axle spacing based on the time it takes the vehicle to
traverse the distance between the loops. Fig. 8 shows a full-lane width piezoelectric WIM system
installation. In this example, two piezoelectric sensors are utilized on either side of the downstream
loop.
Advantages
Typical piezoelectric WIM systems are among the least expensive systems in use today in terms of initial
capital costs and life cycle maintenance costs. Piezoelectric WIM systems can be used at higher speed
ranges (16 to 112 kmph) than other WIM systems. Piezoelectric WIM systems can be used to monitor up
to four lanes.
Disadvantages
Typical piezoelectric systems are less accurate than load cell and bending plate WIM systems.
Piezoelectric sensors for WIM systems must be replaced at least once every 3 years.
Problems:
If the vehicle 10% time occupied by loop M and 32% time occupied by loop N, the distance between
two loops are 4.22 m find the spot speed of the vehicle. Also find the length of the vehicle if time
occupancy for M - loop is 0.26sec and 0.32 for N-loop.
Solution: Length is 4.22 m and occupancy times are 0.32 and 0.1.The speed is given by:
For length calculation, the speed is 19.18 m/sec and occupancy times are 0.26 and 0.32.
The average length of vehicle is 4.25 m and the length of loop detector zone is 1.85 m.
The time occupancy in the loop is 32 percentages, find the spot speed of the vehicle?
Solution: The average vehicle length is 4.25 and detector zone length is 1.85 m and t0 is 0.32.the
spot speed(s) is given by:
In freeway 1500 vehicles are observed during 120 sec interval. The lane occupancy is 65 percentage
and the average length of vehicle observed as 6.55 m. Find the space mean speed on the freeway
section?
Solution: The number of vehicle N is 1500 vehicles; observation period is T= 120 sec.
The lane occupancy O is 0.65 and average length is 6.55, so g is (40.9/6.55) substitute
Each detector technology and particular device has its own limitations and individual capability. The successful application of detector technologies largely depends on proper device selection. Many factors impact detector selection, such as data type, data accuracy, ease of installation, cost and reliability. ILD’s are flexible to satisfy different variety of applications, but installation requires pavement disturb.
I wish to thank several of my students and staff of NPTEL for their contribution in this lecture. Specially, I wish to thank my student K. B. Raghuram for his assistance in developing the lecture note, and my staff Ms. Reeba in typesetting the materials. I also appreciate your constructive feedback which may be sent to tvm@civil.iitb.ac.in. Prof. Tom V. Mathew, Department of Civil engineering, Indian Instiute of Technology Bombay, India.