Vehicle Actuated Signals
Lecture Notes in Transportation Systems Engineering
Contents
______________________________________________________________________
1 Introduction
Now-a-days, controlling traffic congestion relies on having an efficient and well-managed
traffic signal control policy. Traffic signals operate in either pre-timed or actuated mode or
some combination of the two. Pre-timed control consists of a series of intervals that are fixed
in duration. They repeat a preset constant cycle. In contrast to pre-timed signals, actuated
signals have the capability to respond to the presence of vehicles or pedestrians at the
intersection. Actuated control consists of intervals that are called and extended in response to
vehicle detectors. The controllers are capable of not only varying the cycle length & green
times in response to detector actuation, but of altering the order and sequence of phases.
Adaptive or area traffic control systems (ATCS) belong to the latest generation of
signalized intersection control. ATCS continuously detect vehicular traffic volume,
compute optimal signal timings based on this detected volume and simultaneously
implement them. Reacting to these volume variations generally results in reduced delays,
shorter queues and decreased travel times. Coordinating traffic signals along a
single route so that vehicles get progressive green signal at each junction is another
important aspect of ATCS. In the subsequent pages, the operating principles and
features of Vehicle-Actuated Signals & Area Traffic Control Systems will be briefly
discussed.
2 Vehicle-Actuated Signals
2.1 Basic Principles
As stated earlier, Vehicle-Actuated Signals require actuation by a vehicle on one or
more approaches in order for certain phases or traffic movements to be serviced.
They are equipped with detectors and the necessary control logic to respond to the
demands placed on them. Vehicle-actuated control uses information on current
demands and operations, obtained from detectors within the intersection, to alter
one or more aspects of the signal timing on a cycle-by-cycle basis. Timing of the
signals is controlled by traffic demand. Actuated controllers may be programmed to
accommodate:
- Variable phase sequences (e.g., optional protected LT phases)
- Variable green times for each phase
- Variable cycle length, caused by variable green times
Such variability allows the signal to allocate green time based on current demands and
operations. A proper clearance interval between the green & the red phases is also
ensured.
2.2 Advantages of Actuated Signals
The various advantages of actuated signals are stated below:
- They can reduce delay (if properly timed).
- They are adaptable to short-term fluctuations in traffic flow.
- Usually increase capacity (by continually reapportioning green time).
- Provide continuous operation under low volume conditions.
- Especially effective at multiple phase intersections.
2.3 Disadvantages of Actuated Signals
The main disadvantages are as following :
- If traffic demand pattern is very regular, the extra benefit of adding local actuation
is minimal, perhaps non-existent.
- Installation cost is two to three times the cost of a pre-timed signal installation.
- Actuated controllers are much more complicated than pre-timed controllers,
increasing maintenance costs.
- They require careful inspection & maintenance to ensure proper operation.
2.4 Types of Actuated Control
There are three basic types of actuated control, each using signal controllers that are
somewhat different in their design:
- Semi-Actuated Control
- Full-Actuated Control
- Volume-Density Control
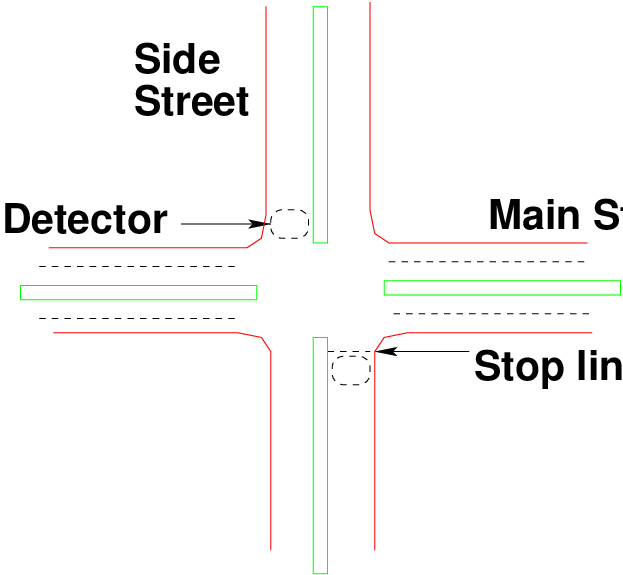
2.4.1 Semi-Actuated Control
This type of controller is used at intersections where a major street having relatively uniform
flow is crossed by a minor street with low volumes. Detectors are placed only on the minor
street. The green is on the major street at all times unless a call on the side street is noted.
The number and duration of side-street green is limited by the signal timing and can be
restricted to times that do not interfere with progressive signal-timing patterns along the major
street.
2.4.2 Full-Actuated Control
This type of controller is used at the intersections of streets or roads with relatively equal
volumes, but where the traffic distribution is varying. In full actuated operation, all
lanes of all approaches are monitored by detectors. The phase sequence, green
allocations, and cycle length are all subjected to variation. This form of control is effective
for both two-phase and multi-phase operations and can accommodate optional
phases.
2.4.3 Volume-Density Control
Volume-density control is basically the same as full actuated control with additional
demand-responsive features. It is designed for intersections of major traffic flows having
considerable unpredictable fluctuations.
2.5 Detection for Actuated Signalization
The various types of detectors used for detection of vehicles are as following:
- Inductive loop detectors
- Magnetometer detectors
- Magnetic detectors
- Pressure-sensitive detectors
- Radar detectors
- Sonic detectors
- Microloop detectors etc.
The vast majority of actuated signal installations use inductive loops for detection purpose. Now,
the type of detection is of greater importance than the specific detection device(s) used.
There are two types of detection that influence the design and timing of actuated
controllers:
- Passage or Point Detection:- In this type of detection, only the fact that the
detector has been disturbed is noted. The detector is installed at a point even
though the detector unit itself may involve a short length. It is the most common
form of detection.
- Presence or Area Detection:- In this type of detection, a significant length (or
area) of an approach lane is included in the detection zone. Entries and exits of
vehicles into and out of the detection zone are remembered. Thus, the number
of vehicles stored in the detection zone is known. It is provided by using a
long induction loop, or a series of point detectors. These are generally used in
conjunction with volume-density controllers.
2.6 Actuated Control Features
Regardless of the controller type, virtually all actuated controllers offer the same basic
functions, although the methodology for implementing them may vary by type and
manufacturer. For each actuated phase, the following basic features must be set on the
controller:
2.6.1 Minimum Green Time
Each actuated phase has a minimum green time, which serves as the smallest amount of
green time that may be allocated to a phase when it is initiated. Minimum green times must be
set for each phase in an actuated signalization, including the non-actuated phase of a
semi-actuated controller. The minimum green timing on an actuated phase is based on the
type and location of detectors.
- In case of Point Detectors,
![Gmin = tL + [h × Integer(d∕x)]](web0x.png) | (1) |
where, Gmin = minimum green time in second, tL = assumed start-up lost time
= 4 sec, h = assumed saturation headway = 2 sec, d = distance between
detector & stop line in m and x = assumed distance between stored vehicles = 6
m.
- In case of Area Detectors,
 | (2) |
where, tL = start-up lost time (sec) and n = number of vehicles stored in the detection
area.
2.6.2 Unit Extension
This time actually serves three different purposes:
- It represents the maximum gap between actuation at a single detector required to
retain the green.
- It is the amount of time added to the green phase when an additional actuation is
received within the unit extension, U.
- It must be of sufficient length to allow a vehicle to travel from the detector to the
STOP line.
In terms of signal operation, it serves as both the minimum allowable gap to retain a green signal
and as the amount of green time added when an additional actuation is detected
within the minimum allowable gap. The unit extension is selected with two criteria in
mind:
- The unit extension should be long enough such that a subsequent vehicle
operating in dense traffic at a safe headway will be able to retain a green signal
(assuming the maximum green has not yet been reached).
- The unit extension should not be so long that straggling vehicles may retain the
green or that excessive time is added to the green (beyond what one vehicle
reasonably requires to cross the STOP line on green).
The Traffic Detector Handbook recommends that a unit extension of 3.0 s be used where
approach speeds are equal to or less than 30 mile per hour, and that 3.5 s be used at higher
approach speeds. For all types of controllers, however, the unit extension must be equal to or
more than the passage time.
2.6.3 Passage Time Interval
It allows a vehicle to travel from the detector to the stop line. It is analogous with ’Unit
Extension’.
 | (3) |
where, P = passage time, sec, d = distance from detector to stop line, meter and S =
approach speed of vehicles, m/s.
2.6.4 Maximum Green Time
Each phase has a maximum green time that limits the length of a green phase, even if there
are continued actuation that would normally retain the green. The maximum green time
begins when there is a call (or detector actuation) on a competing phase. The estimation can
be done by any of the following methods:
- By trial signal timing as if the signals were pre-timed
![Ci = -----------L-------------
[1- VC ∕(1615(P HF )(v∕c))]](web3x.png) | (4) |
where, Ci = Initial cycle length, sec, L = Total lost time, sec and V C = Sum of critical
lane volumes, veh/hr. Knowing the initial cycle length, green times are then determined
as:
 | (5) |
where gi = effective green time for Phase i, sec and V Ci = critical lane volume for Phase
i, veh/hr. The effective green times thus obtained are then multiplied by 1.25 or 1.50 to
determine the maximum green time.
- By Green-Time Estimation (HCM) Model: Traffic-actuated controllers do not recognize
specified cycle lengths. Instead they determine, by a mechanical analogy, the required
green time given the length of the previous red period and the arrival rate. They
accomplish this by holding the right-of-way until the accumulated queue has been
served.
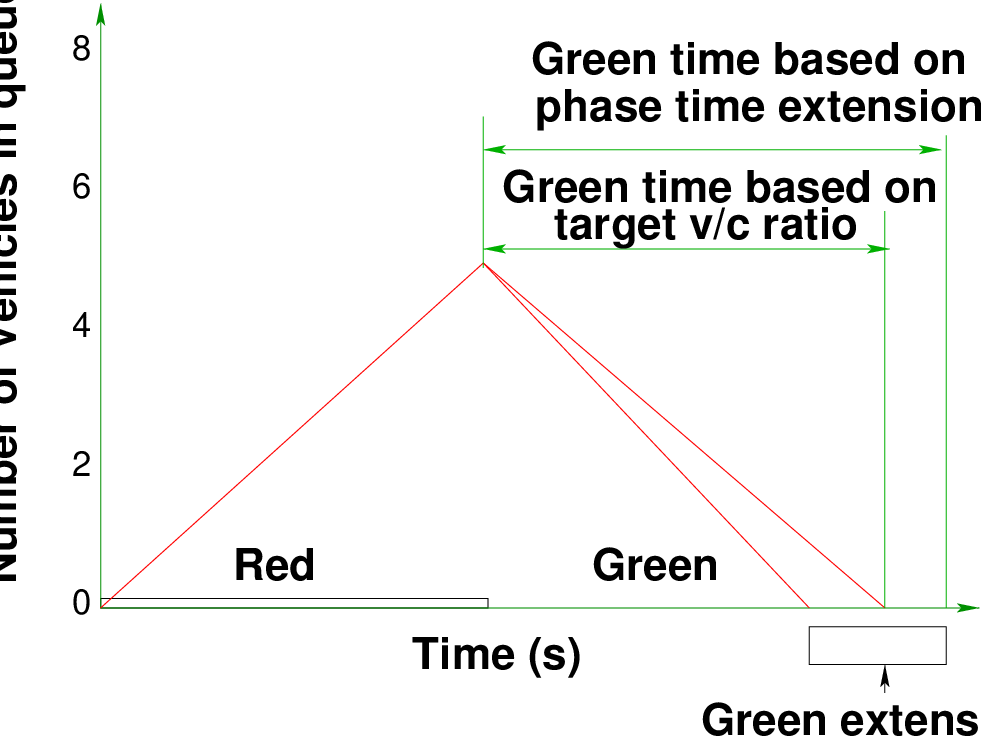
The basic principle underlying all signal timing analysis is the queue accumulation polygon
(QAP), which plots the number of vehicles queued at the stop line over the duration
of the cycle. The QAP for a simple protected movement is illustrated in the Fig. 1.
From Fig. 1, it’s clear that queue accumulation takes place on the left side of the triangle
(i.e., effective red) and the discharge takes place on the right side of the triangle (i.e., effective
green).
There are two methods of determining the required green time given the length of the
previous red time. The first employs a target v/c approach. Under this approach, the
green-time requirement is determined by the slope of the line representing the target v/c of
0.9. If the phase ends when the queue has dissipated under these conditions, the
target v/c will be achieved. The second method recognizes the way a traffic-actuated
controller really works. It does not deal explicitly with v/c ratios; in fact, it has no way of
determining the v/c ratio. Instead it terminates each phase when a gap of a particular
length is encountered at the detector. Good practice dictates that the gap threshold
must be longer than the gap that would be encountered when the queue is being
served. Assuming that gaps large enough to terminate the phase can only occur after
the queue service interval (based on v/c = 1.0), the average green time may be
estimated as the sum of the queue service time and the phase extension time.
Therefore, average green time = Queue Service Time + Phase Extension Time.
Now,
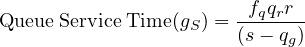 | (6) |
where, qr = red arrival rate (veh/s), qg = green arrival rate (veh/s), r = effective
red time (s), s = saturation flow rate (veh/s) and fq = calibration factor = 1.08 -
0.1(actual green time∕maximum green time)2
![Green extension time (ge) = [exp(λ(u+ t- Δ ))∕Φq]- (1∕λ)](web6x.png) | (7) |
where, q = vehicle arrival rate throughout cycle (veh/s), u = unit extension time setting (s), t =
time during which detector is occupied by a passing vehicle(s) = [3.6(Ld + Lv)]∕SA, Lv =
Vehicle length, assumed to be 5.5 m, Ld = Detector length (m), SA= Vehicle approach speed
(kmph), Δ = minimum arrival (intra-bunch) headway (s), λ = a parameter (veh/s) =
Φq∕(1 - Δq), Φ = proportion of free (unbunched) vehicles in traffic stream = exp(-bΔq) and b
= bunching factor.
This green-time estimation model is not difficult to implement, but it does not lead directly
to the determination of an average cycle length or green time because the green time
required for each phase is dependent on the green time required by the other phases. Thus, a
circular dependency is established that requires an iterative process to solve. With each
iteration, the green time required by each phase, given the green times required by the other
phases, can be determined. The logical starting point for the iterative process involves the
minimum times specified for each phase. If these times turn out to be adequate for all phases,
the cycle length will simply be the sum of the minimum phase times for the critical phases. If
a particular phase demands more than its minimum time, more time should be
given to that phase. Thus, a longer red time must be imposed on all of the other
phases. This, in turn, will increase the green time required for the subject phase.
Table 1: Recommended Parameter Values
|
|
|
| Case | Δ(s) | b |
|
|
|
| Single Lane | 1.5 | 0.6 |
|
|
|
| Multi-lane | | |
| 2 lanes | 0.5 | 0.5 |
| 3 lanes | 0.5 | 0.8 |
|
|
|
| |
2.6.5 Recall Switch
Each actuated phase has a recall switch. The recall switches determine what happens to
the signal when there is no demand. Normally, one recall switch is placed in the
on position, while all others are turned off. In this case, when there is no demand
present, the green returns to the phase with its recall switch on. If no recall switch is in
the on position, the green remains on the phase that had the last ”call.”demand
exists, one phase continues to move to the next at the expiration of the minimum
green.
2.6.6 Change and Clearance Intervals
Yellow and all-red intervals provide for safe transition from green to red. They are fixed times
and are not subject to variation, even in an actuated controller. They are found in the same
manner as for pre-timed signals.
![y = t+ [S85∕(2a+ 19.6g)]](web7x.png) | (8) |
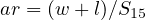 | (9) |
where, y = yellow time, sec, ar = all red interval, sec, S85 = 85th percentile speed, m/s, S15 =
15th percentile speed, m/s, t = reaction time of the driver = 1 sec (standard), a = deceleration
rate = 3 m/s2 (standard), g = grade of approach in decimal, w = width of street being crossed,
m and l = length of a vehicle, m.
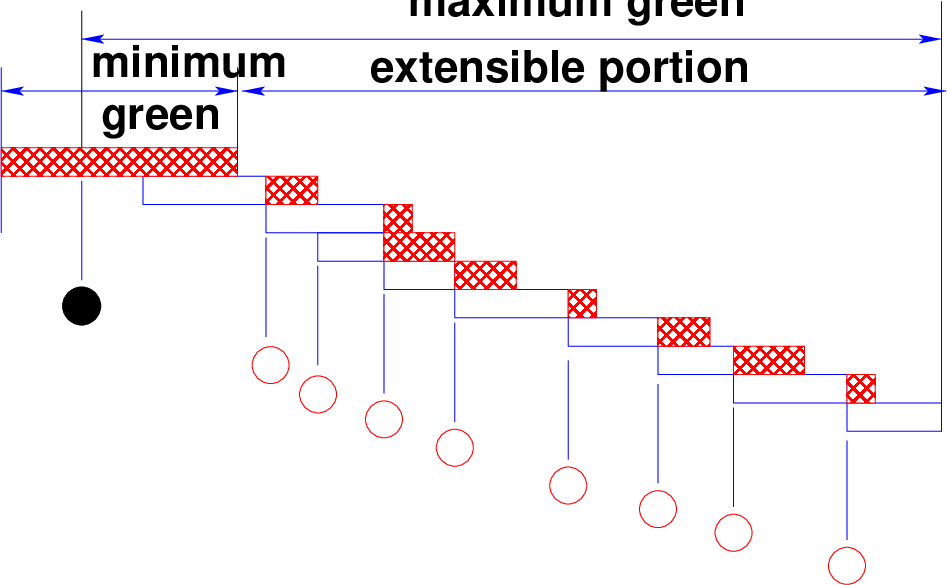
2.7 Operating Principle
The Fig. 2 illustrates the operation of an actuated phase based on the three critical
settings: minimum green, maximum green, and unit or vehicle extension. When the green is
initiated for a phase, it will be at least as long as the minimum green period. The controller
divides the minimum green into an initial portion and a portion equal to one unit extension. If
an additional call is received during the initial portion of the minimum green, no time is added
to the phase, as there is sufficient time within the minimum green to cross the STOP line
(yellow and all-red intervals take care of clearing the intersection). If a call is received
during the last U seconds (Unit Extension) of the minimum green, U seconds of
green are added to the phase. Thereafter, every time an additional call is received
during a unit extension of U seconds, an additional period of U seconds is added
to the green. Note that the additional periods of U seconds are added from the
time of the actuation or call. They are not added to the end of the previous unit
extension, as this would accumulate unused green times within each unit extension
and include them in the total green period. The green is terminated in one of two
ways:
- a unit extension of U seconds expires without an additional actuation,
- the maximum green is reached.
The maximum green begins timing out when a call on a competing phase is noted. During the
most congested periods of flow, however, it may be assumed that demand exists more or less
continuously on all phases. The maximum green, therefore, begins timing out at the beginning
of the green period in such a situation. Now-a-days, in India, detectors are placed mostly at
stop lines. In that case, the green times for phases are primarily determined by arrival
headway. The green time is extended until the gap between two vehicles becomes equal to or
greater than the pre-determined threshold value. Generally threshold of 4 seconds is
considered.
Table 2: Recommended Detector Locations & Timing Parameters
|
|
|
|
| Approach | Detector Set-Back | Mimi-mum | Passage |
| Speed | (To front of loop) | Green | Time |
| (kmph) | (m) | (sec) | (sec) |
|
|
|
|
| 24 | 12 | 8.0 | 3.0 |
| 32 | 18 | 10.0 | 3.0 |
| 40 | 24 | 12.0 | 3.0 |
| 48 | 30 | 14.0 | 3.5 |
| 56 | 41 | 18.0 | 3.5 |
| 64 | 52 | 22.0 | 3.5 |
|
|
|
|
| 72+ | Volume density or multiple detectors recommended
|
|
|
|
|
| |
2.8 Concept of Semi-Actuated Controller
2.8.1 Principles
- Detectors on minor approaches only.
- Major phase receives a minimum green interval.
- The green remains on the main street until a call for service on the side street is
registered.
- If the main street has had enough green, the side street is given the green for just
enough time to guarantee that its vehicles are processed.
- Usually Point Detectors are used.
- Detectors can be placed at either stop line or upstream location.
2.8.2 Advantages
- It can be used effectively in a coordinated signal system.
- Relative to pre-timed control, it reduces the delay incurred by the major-road
through movements during periods of light traffic.
- It does not require detectors for the major-road through movement phases and
hence, its operation is not compromised by the failure of these detectors.
- Generally the main street indeed has the green whenever possible.
2.8.3 Disadvantages
- Continuous demand on the phases associated with one or more minor
movements can cause excessive delay to the major road through movements if
the maximum green and passage time parameters are not appropriately set.
- Detectors must be used on the minor approaches, thus requiring installation and
ongoing maintenance.
- It also requires more training than that needed for pre-timed control.
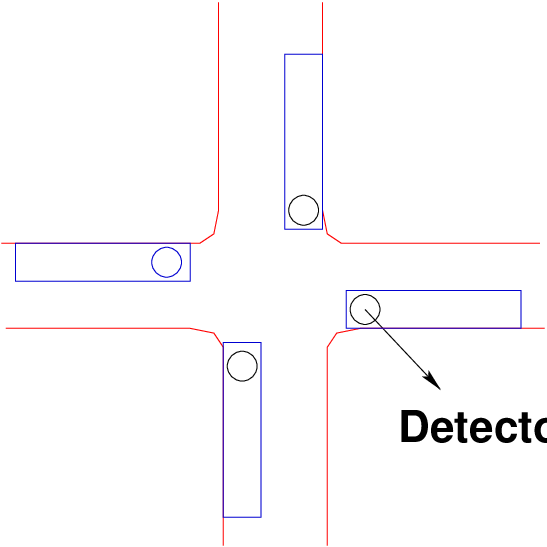
2.9 Concept of Full-Actuated Controller
2.9.1 Principles
- Detectors on all approaches.
- Each phase has a preset initial interval.
- Phases are sequenced according to ”calls” for service on all approaches.
- Green interval is extended by a preset unit extension for each actuation after the
initial interval provided a gap greater than the unit extension does not occur.
- Green extension is limited by preset maximum limit.
- Generally Point Detectors are used.
- Detectors can be placed at either stop line or upstream location.
2.9.2 Advantages
- Reduces delay relative to pre-timed control by being highly responsive to traffic
demand and to changes in traffic pattern.
- Detection information allows the cycle time to be efficiently allocated on a
cycle-by-cycle basis.
- Allows phases to be skipped if there is no call for service, thereby allowing the
controller to reallocate the unused time to a subsequent phase.
2.9.3 Disadvantages
- Initial and maintenance cost is higher than that of other control types due to the
amount of detection required.
- It may also result in higher percentage of vehicles stopping because green time
is not held for upstream platoons.
2.10 Concept of Volume-Density Controller
Volume-Density Controllers are designed for intersections of major traffic flows having
considerable unpredictable fluctuations. They are generally used at intersections with high
approach speeds (≥ 45 mi/hr). Here, detectors are placed on all approaches. Generally this
type of controller is used with Area Detectors. To operate efficiently, this type of control needs
to receive traffic information early enough to react to existing conditions. So, it is essential that
detectors be placed far in advance of the intersection.
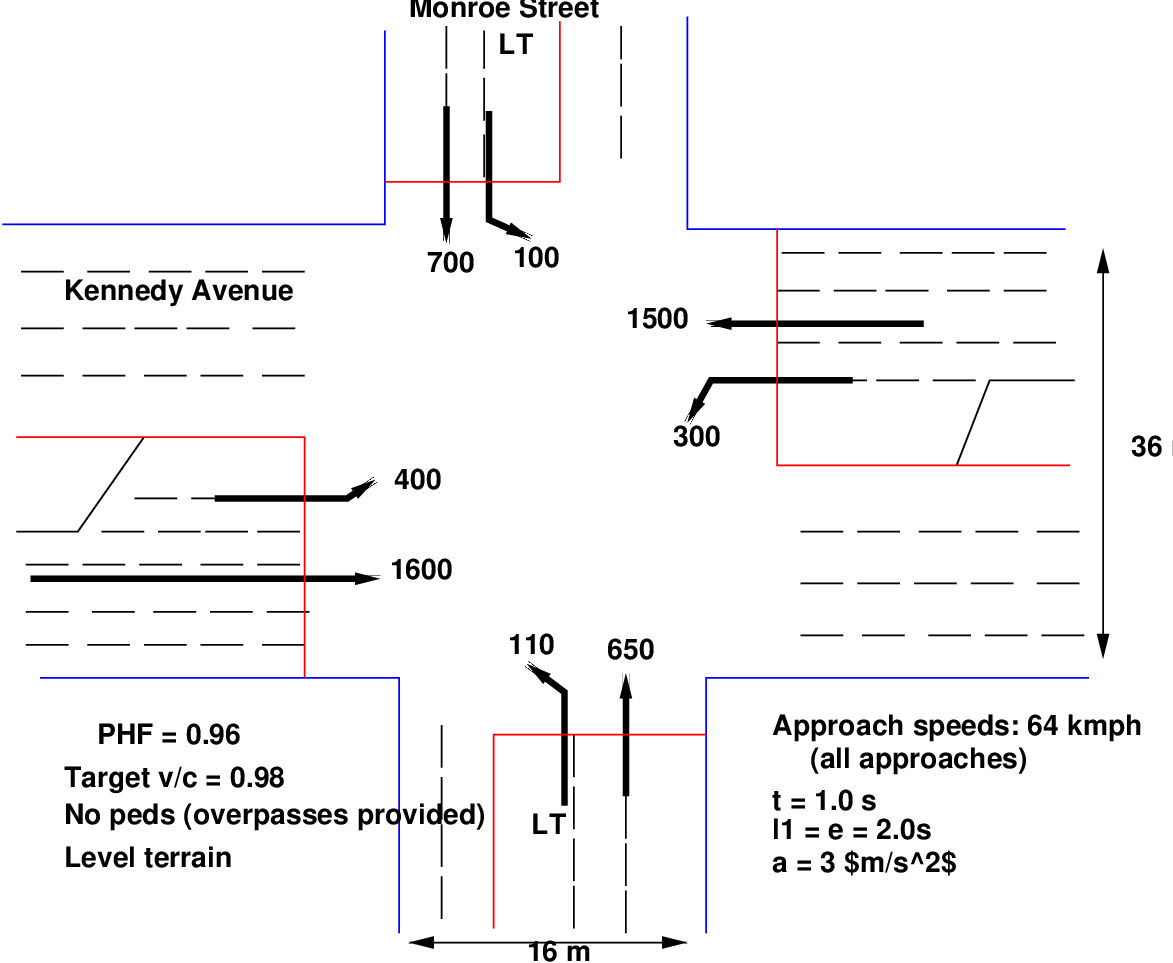
2.11 Numerical example
An isolated suburban intersection of two major arterial is to be signalized using a full
actuated controller. Area detection is to be used, and there are no driveways or other
potential entry points for vehicles within 90 m of the STOP line on all approaches. The
intersection is shown in the figure and all volumes have already been converted to tvus for
convenience. Left-turn slots of 75 m in length are provided for each approach. The tvu
conversions assume that a protected left-turn phase will be provided for all approaches.
Solution:
Step 1: Phasing: The problem statement indicates that protected left-turn phasing will be
implemented on all approaches. Note that Kennedy Avenue has double left-turn
lanes in each direction and that Monroe Street has a single left-turn lane in each
direction. At a heavily utilized intersection such as this, quad-eight phasing would
be desirable. Each street would have an exclusive LT phase followed by a leading
green in the direction of heavier LT flow and a TH/RT phase. Such phasing provides
much flexibility in that LT phasing is always optional and can be skipped in any cycle
in which no LT demand is noted. The resulting signalization has a maximum of
four phases in any given cycle and a minimum of two. It is treated as a four-phase
signal, as this option leads to the maximum lost times. Quad-eight phasing involves
overlaps that would be taken into account if this were a pre-timed signal. As an
actuated signal, the worst-case cycle, however, would occur when there are no overlap
periods. This would occur when the LT flow in opposing directions are equal. Thus,
the signal timing will be considered as if this were a simple four-phase operation
without overlaps. The controller, however, will allow one protected LT to be terminated
before the opposing protected LT, creating a leading green phase. The four phases
are:
- Phase I-Protected LT for Kennedy Avenue
- Phase 2-TH/RT for Kennedy Avenue
- Phase 3-Protected LT for Monroe Street
- Phase 4-TH/RT for Monroe Street
Step 2: Unit Extension: For approach speeds of 64 kmph, the recommended unit
extension (from Table) is 3.5 s.
Step 3: Minimum Green Times and Detector Placement: The problem specifies that area
detection shall be employed. For area detection, the far end of the detection zone is placed
such that the passage time is equal to unit extension. Since all approaches (including LT
approaches) have a 64 kmph approach speed, the far end of detectors should be located as
follows:
The near end of the detection zone would be placed within 0.3 m of the STOP line. The
minimum green time for area detection is variable, based on the number of vehicles
sensed within the detection area when the green is initiated. The value can vary
from the time needed to service one waiting vehicle to the time needed to service
Int(62/6) = 11 vehicles. The range of minimum green times can be established for each
approach. In this case, all values will be equal, as the approach speeds are the
same for all approaches and the detector location is common to every approach,
including the LT lanes, all of which are long enough to accommodate a 62 m setback.
Step 4: Critical-Lane Volumes: As the volumes given have already been converted to
tvus, critical-lane volumes for each phase are easily identified:
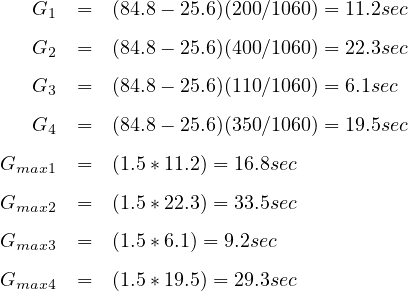
- Phase 1 (Kennedy Ave, LT) - 400/2 = 200 tvu/h
- Phase 2 (Kennedy Ave, TH/RT) - 1,600/4 = 400 tvu/h
- Phase 3 (Monroe St, LT) - 110/1 = 110 tvu/h
- Phase 4 (Monroe St, TH/RT) - 700/2 = 350 tvu/h
Therefore, VC = (200+400+110+700) = 1,060 tvu/h.
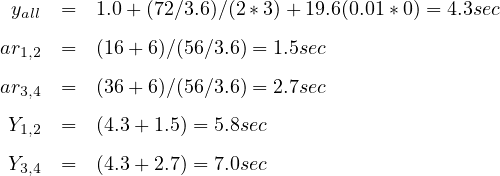
Step 5: Yellow & All-Red times With a 64 kmph average approach speed for all
movements, the S85 may be estimated as (64 + 8) = 72 kmph, and the S15 may be estimated
as (64 - 8) = 56 kmph. Then:
There are four phases in the worst-case cycle. The total lost time is equal to the sum of the
yellow and all-red intervals in the cycle: L = 2*5.8 + 2*7.0 = 25.6 sec.
Step 6: Maximum Green Times and the Critical Cycle: The initial cycle length for
determining maximum green time is: Ci = 25.6/[1-1060/(1615*0.96*0.98)] = 84.8 sec. Green
times are found as:
With area detection, the minimum green for all lane groups, including LT lanes, can
be as high as 24.0 s. This is inconsistent with Gmax values for the LT Phases 1
and 3. Increasing the maximum greens beyond the computed values, however,
will lead to an excessively long critical cycle length. Thus, it is recommended that
the LT lanes use point detectors, placed so that the Gmin for Phases 1 and 3 is a
constant 4.0 s. The above Gmax results will work in this scenario. The Gmax results for
Phases 2 and 4 (through phases) are close to the high value of Gmin for these
phases, but would provide some flexibility even in peak periods. It is, therefore, not
recommended that any of these times be arbitrarily increased. The critical cycle
length becomes: CC = 16.8 + 5.8 + 33.5 + 5.8 + 9.2 + 7.0 + 29.3 + 7.0 = 114.4
sec
2.12 Numerical example
Consider an intersection of two streets with a single lane in each direction. Each approach
has identical characteristics and carries 675 veh/h with no left or right turns. The average
headway is 2.0 s per vehicle and the lost time per phase is 3.0 s. Detectors are 9.1 m
long with no setback from the stop line. The actuated controller settings are as
follows:
|
|
| Setting | Time (s) |
|
|
| Initial interval | 10 |
| Unit extension | 3 |
| Maximum green | 46 |
| Intergreen | 4 |
|
|
| |
Determine the phase time for this intersection with actuated controller for approach speed
50 kmph.
Solution:
The maximum phase time for each phase will be (46 + 4) = 50 s. The minimum phase time
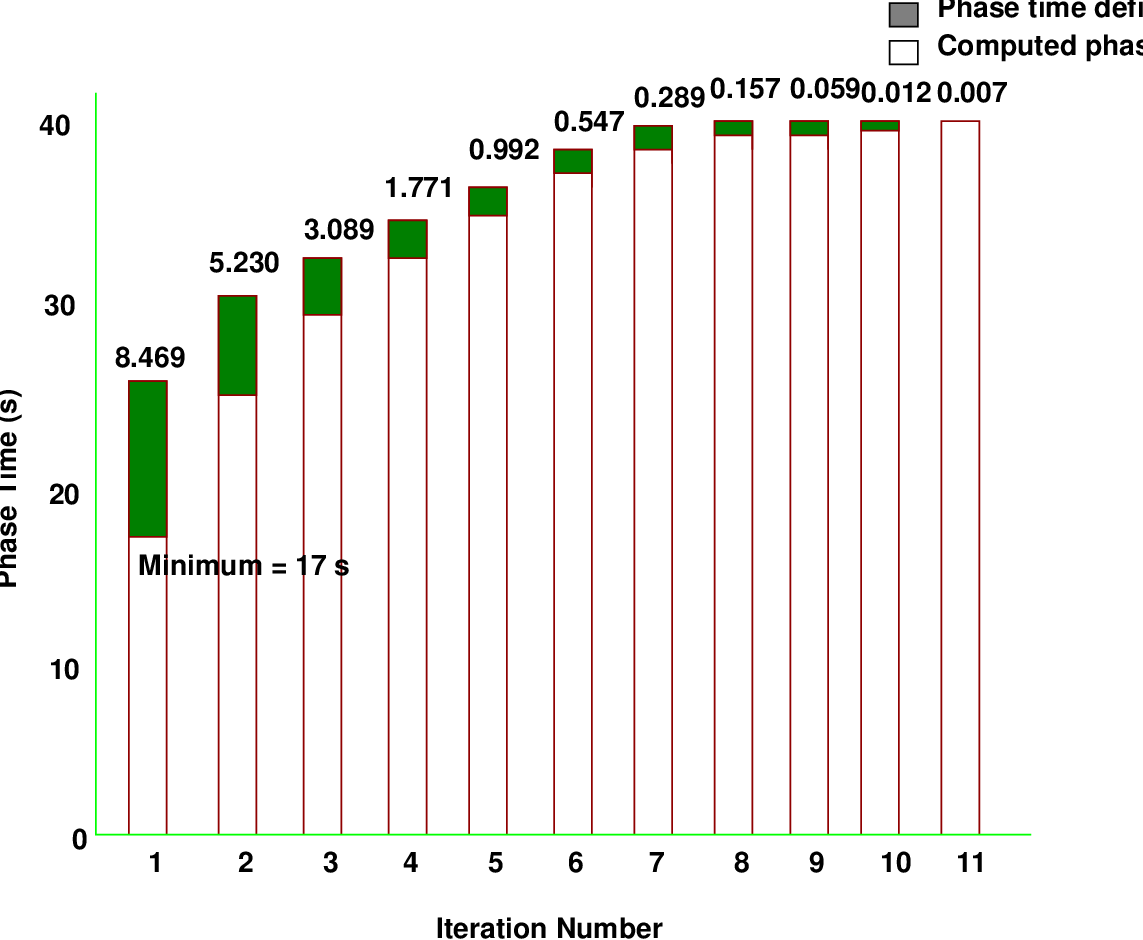
will be 10 + 3 + 4 = 17 s. The first iteration will be used with a 34-s cycle with 17 s of green
time on each approach. The effective green time will be 14 s, and the effective red time
will be 20 s for each phase. For purposes of traffic-actuated timing estimation It
is recommended (HCM 2000) that, for a specified lost time of n seconds, 1 s be
assigned to the end of the phase and (n - 1) s be assigned to the beginning. Here,
start-up lost time = 2.0 secs. The following are the steps to calculate the phase time
required:
Step 1. Compute the arrival rate throughout the cycle, q: q = 675/3600 = 0.188
veh/s
Step 2. Compute the net departure rate (saturation flow rate - arrival rate): (s - q)
=1800/3600- 0.188 = 0.312 veh/s
Step 3.Compute the queue at the end of 20 s of effective red time:
qrr = 20 × (0.188) = 3.760veh
Step 4. Compute the queue calibration factor,fq: fq = 1.08 - 0.1(13∕46)2 = 1.072
Step 5. Compute the time required to serve the queue, gs: gs = 1.072(3.760∕0.312) = 12.919s
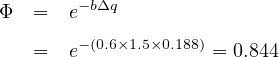
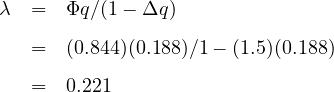
Step 6. Determine λ: Δ = 1.5 and b = 0.6 (for single lane from table in HCM)
Step 7. Determine the occupancy time of the detector: t0 = 3.6(9.1+ 5.5)/50, vehicle
length=5.5m, detector = 1.051 s length=9.1 m, approach speed=50 kmph
Step 8. The expected green extension time, ge:
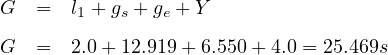
Step 9. Compute the total phase time:
Step 10. Compute the phase time deficiency as the difference between the trial
phase time and the computed phase time: or 25.469 - 17.0 = 8.469 s. For next iteration:
Trial green time = 25.469 s. Cycle length = 50.968 s. This process is continued through
successive iterations until the solutions converge or the phase deficiency i.e. the error is
negligible practically. The following figure shows the results of successive iterations for this
problem and the final convergence.
The final phase time is 37.710 s giving a cycle length of 75.420 s. The convergence was
considered for threshold of 0.1 difference in successive cycle times.
3 Conclusion
Modern actuated controllers give the traffic engineers a great deal of flexibility in dealing with
variations in demand. Area traffic control system along with Vehicle actuated signals can
reduce traffic delays substantially. These are highly complex subject. Timing of VA signals is
almost as much an art as a science, and more then one solution is possible. Regarding ATC
systems, SCOOT and SCAT are popular in advance countries but such systems cannot cope
up with Indian situations without adaptation to Indian traffic scenario. Presently, an advance
ATC system known as CoSiCoSt has been developed considering the Indian Traffic
scenario.
Exercises
- Describe the working principle and various control parameters of a vehicle
actuated controller and its limitations.
References
- Highway Capacity Manual. Transportation Research Board. National Research
Council, Washington, D.C., 2000.
- L R Kadiyali. Traffic Engineering and Transportation Planning. Khanna
Publishers, New Delhi, 1987.
- C. S Papacostas. Fundamentals of Transportation Engineering. Prentice-Hall,
New Delhi, 1987.
- D I Robertson and R D Bretherton. Optimizing Networks of Traffic Signals in
Real Time - The SCOOT Method. IEEE Transactions on Vehicular Technology,
1991.
- R J Salter. Highway Traffic Analysis And Design. McGraw-Hill, 1990.
- S H Shinde. Evaluation of Area traffic Control system. Department of
Transportation engineering, IIT Bombay, 2007.
Acknowledgments
I wish to thank several of my students and staff of NPTEL for their contribution in this lecture. I
wish to thank specially my student Mr. Kaniska Ghosh for his assistance in developing the
lecture note, and my staff Mr. Rayan in typesetting the materials. I also appreciate your
constructive feedback which may be sent to tvm@civil.iitb.ac.in
Prof. Tom V. Mathew
Department of Civil Engineering
Indian Institute of Technology Bombay, India
_________________________________________________________________________
Thursday 28 September 2023 10:47:46 AM IST